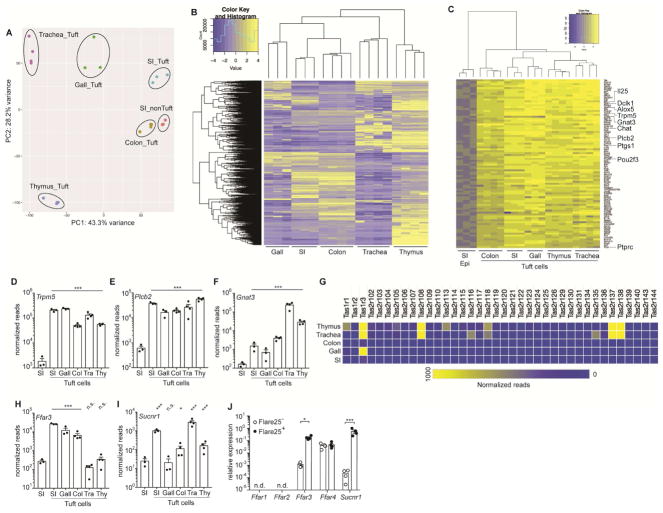
Figure 1. RNA-Seq identifies a transcriptional tuft cell signature and a tissue-specific chemosensory receptor repertoire.
(A–I) Tuft cells (CD45lo EPCAM+ Flare25+) were sorted from small intestine (SI), gall bladder (Gall), colon (Col), trachea (Tra), and thymus (Thy) of naïve B6.Il25Flare25/Flare25 mice for mRNA sequencing. Non-tuft epithelial cells of the small intestine (SI Epi; CD45lo EPCAM+ Flare25−) were sorted as a negative control. (A) Principle component analysis of gene expression. (B) Hierarchical clustering of differentially expressed genes (fold change > 8; FDR < 0.01) among tuft cell subsets. (C) Ranked list of a tuft cell transcriptional signature (Log2 fold-change >4 in all tuft cells relative to SI Epi). (D–F) Normalized read count of indicated genes. G) Heat map of normalized read count of all taste receptors. (H–I) Normalized read count of indicated genes. (J) Indicated genes analyzed by RT-qPCR in small intestinal tuft cells (Flare25+) and non-tuft epithelial cells (Flare25−). A–I: biological replicates from one mRNA sequencing experiment. J: biological replicates pooled from three experiments. In A–I *, FDR < .05; ***, FDR < .001 by statistical analysis in RNAseq pipeline. In J *, p < 0.05; ***, p < 0.001 by multiple t-tests. n.s., not significant; n.d., not detectable. Graphs show mean + SEM. Also see Figure S1.

