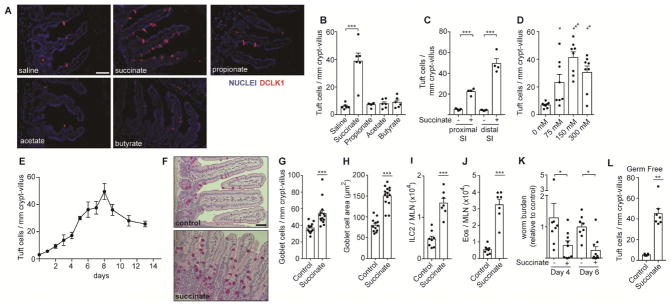
Figure 2. Succinate is sufficient to induce a type 2 immune response in the small intestine.
(A–J) Unless otherwise indicated, wild-type mice were given 150 mM succinate or control water for 7 d. (A) Representative images of distal (last 10 cm) small intestine (SI). DCLK1 marks tuft cells. Scale bar = 50 μm (B) Quantification of tuft cells in A. (C) Tuft cell quantification by microscopy in the proximal (first 10 cm) and distal SI (D–E) Tuft cell quantification in the distal SI at indicated (D) succinate concetrations and (E) timepoints. (F) Representative images of middle (10–20 cm from cecum) SI stained with periodic acid-Schiff to visualize goblet cells. Scale bar = 50 μm. (G–H) Quantification of goblet cell (G) numbers and (H) hypertrophy. (I–J) Absolute numbers of (I) ILC2s and (J) eosinophils quantified in MLN by flow cytometry. (K) Total worm burden in wild-type mice that received 7 d treatment with 150mM succinate or water control prior to and during infection with N. brasiliensis. Worm burden represented as relative to median of control within each experiment. (L) Tuft cell quantification in distal SI of germ-free mice treated as in A–J. In B–D, G–L each symbol represents an individual mouse from at least three pooled experiments. In E, each symbol represents the average of 3–9 mice pooled from three experiments. *, p < 0.05; **, p < 0.01; ***, p < 0.001 by one-way ANOVA with comparison to control (B, D), by Mann-Whitney (G–J, L), or by multiple t-test (C, K). Graphs depict mean + SEM. Also see Figure S2.

