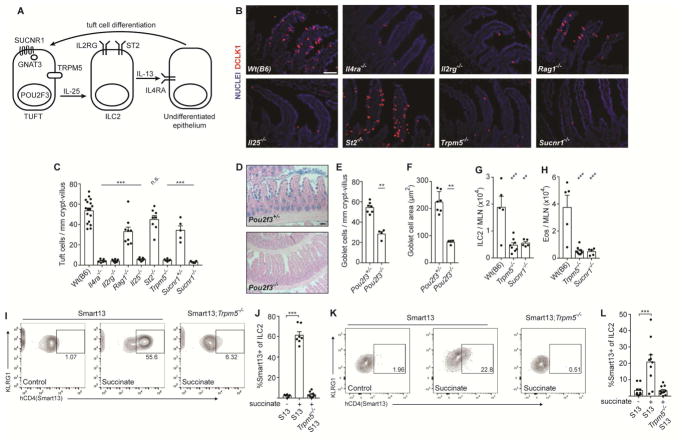
Figure 3. Succinate signals via the tuft cell-ILC2 circuit in a TRPM5 and SUCNR1-dependent manner.
(A) Schematic of cells and proteins in the tuft-ILC2 circuit. (B–J Mice of indicated genotypes were given 150 mM succinate for 7 d. (B) Representative images of distal (last 10 cm) small intestine (SI). DCLK1 marks tuft cells. Scale bar = 50 μm. (C) Quantification of tuft cells in B. (D) Representative images of middle (10–20 cm from cecum) SI stained with Alcian blue to visualize goblet cells. Scale bar = 100 μm. (E–F) Quantification of goblet cell (E) numbers and (F) hypertrophy in D. (G–J) MLN analyzed by flow cytometry to quantify (G) ILC2s, (H) eosinophils, and (I–J) IL-13 production by ILC2s. Smart13: IL-13 reporter. (K–L) Lamina propria cells from mice of indicated genotypes given 150 mM succinate for 36 hours and analyzed as in I–J. In C–H, J–L each symbol represents one mouse from at least two pooled independent experiments. *, p < 0.05; **, p < 0.01; ***, p < 0.001 by one-way ANOVA (C, G–H, J, L) with comparison to Wt(B6) or untreated Smart13 control, or by Mann-Whitney (E–F). n.s., not significant. Graphs depict mean + SEM. Also see Figure S3.

