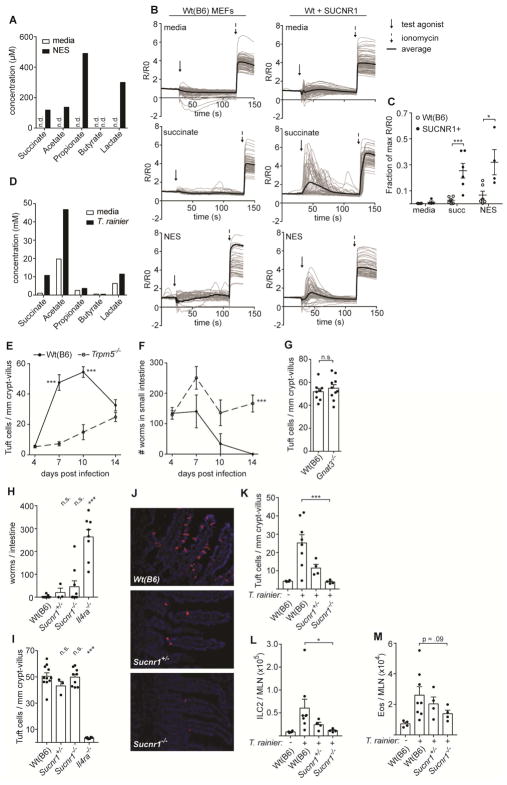
Figure 4. Immune sensing of T. rainier but not N. brasiliensis requires SUCNR1.
(A) Concentration of indicated molecules measured in N. brasiliensis excretory-secretory product (NES) or media control by NMR. (B) Representative calcium fluxes in wild-type (B6) or SUCNR1-transduced MEFs treated as indicated. (C) Quantification of B. (D) Concentrations of indicated molecules measured in T. rainier conditioned media or media alone by NMR. (E–I) Mice of indicated genotypes were infected with N. brasiliensis. (E) Tuft cell quantification in the distal (last 10 cm) small intestine (SI), and (F) total worm burden at indicated times. (G) Tuft cell quantification in the distal SI 7 d post infection. (H) Tuft cell quantification in the distal SI and (I) total worm burden 8 d post infection. (J–M) Mice of indicated genotypes were colonized with T. rainier for 7 d or left untreated. (J) Representative images of distal SI. DCLK1 marks tuft cells. Scale bar = 50 μm. (K) Quantification of tuft cells in J. (L–M) MLN analyzed by flow cytometry to quantify (L) ILC2s and (M) eosinophils. A–B, D show representative data from at least two independent experiments. In C, each symbol represents one technical replicate. In G–I, K–M each symbol represents one mouse from at least two pooled experiments. In E–F each symbol represents the average of 3–10 mice from three pooled experiments. *, p < 0.05; **, p < 0.01; ***, p < 0.001 by one-way ANOVA (H–I, K–M) with comparison to Wt(B6) control, by Mann-Whitney (G), or using multiple t-tests (C, E, F). n.s., not significant. Graphs depict mean + SEM. Also see Figure S4.

