. 2018 Jun 28;126(6):067009. doi: 10.1289/EHP3368

Figure 5.

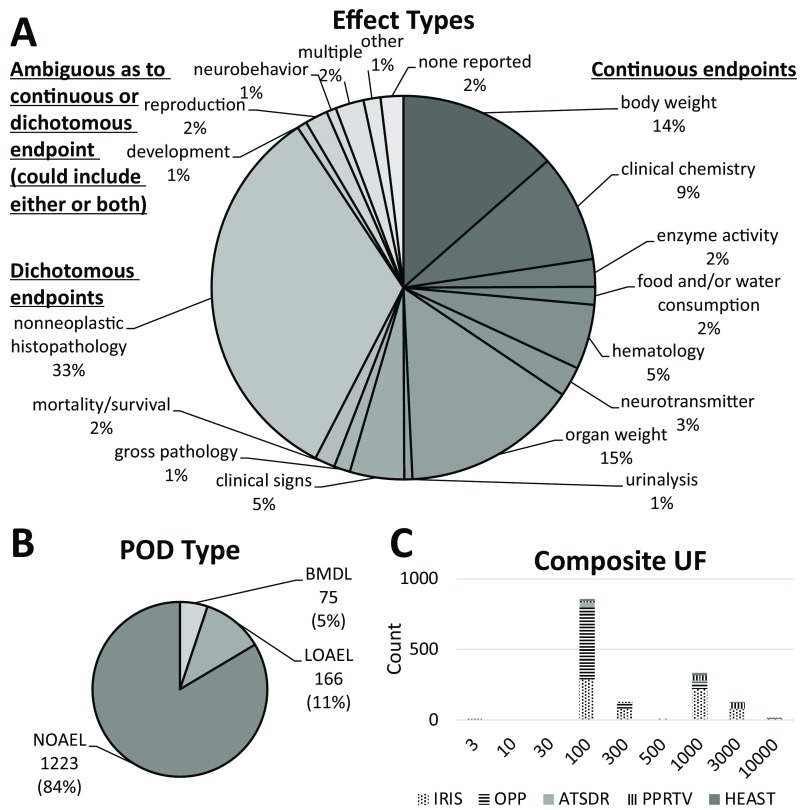
Figure 5A is a pie chart showing distribution of the following effect types: continuous endpoints—organ weight (15 percent), body weight (14 percent), clinical chemistry (9 percent), hematology (5 percent), neurotransmitter (3 percent), enzyme activity (2 percent), and food and/or water consumption (2 percent); dichotomous endpoints—nonneoplastic histopathology (33 percent), clinical signs (5 percent), mortality or survival (2 percent), and gross pathology (1 percent); and ambiguous as to continuous or dichotomous endpoints (could include either or both)—reproduction (2 percent), none reported (2 percent), development (1 percent), neurobehavior (1 percent), other (1 percent), and multiple (negative 2 percent). Figure 5B is a pie chart showing distribution of the following P O D type: N O A E L, 1223 (84 percent); L O A E L, 166 (11 percent); and BMDL, 75 (5 percent). Figure 5C is a stacked bar graph plotting counts (y-axis) across databases I R I S, O P P, A T S D R, P P R T V, and H E A S T (x-axis).

Characteristics of the database of references doses (RfDs). (A) Distribution of toxicological effects, including continuous endpoints, dichotomous endpoints, and endpoints that could be either continuous or dichotomous. (B) Distribution of types of points of departure (POD), including NOAEL (no observed adverse effect level), LOAEL (lowest observed adverse effect level), and BMDL (benchmark dose lower confidence limit). (C) Distribution of composite uncertainty factors (UFs) applied across RfDs, depending on source (IRIS, Integrated Risk Information System; OPP, Office of Pesticide Programs; ATSDR, Agency for Toxic Substances and Disease Registry; PPRTV, Provisional Peer-reviewed Toxic Values; HEAST, Health Effects Assessment Summary Tables).