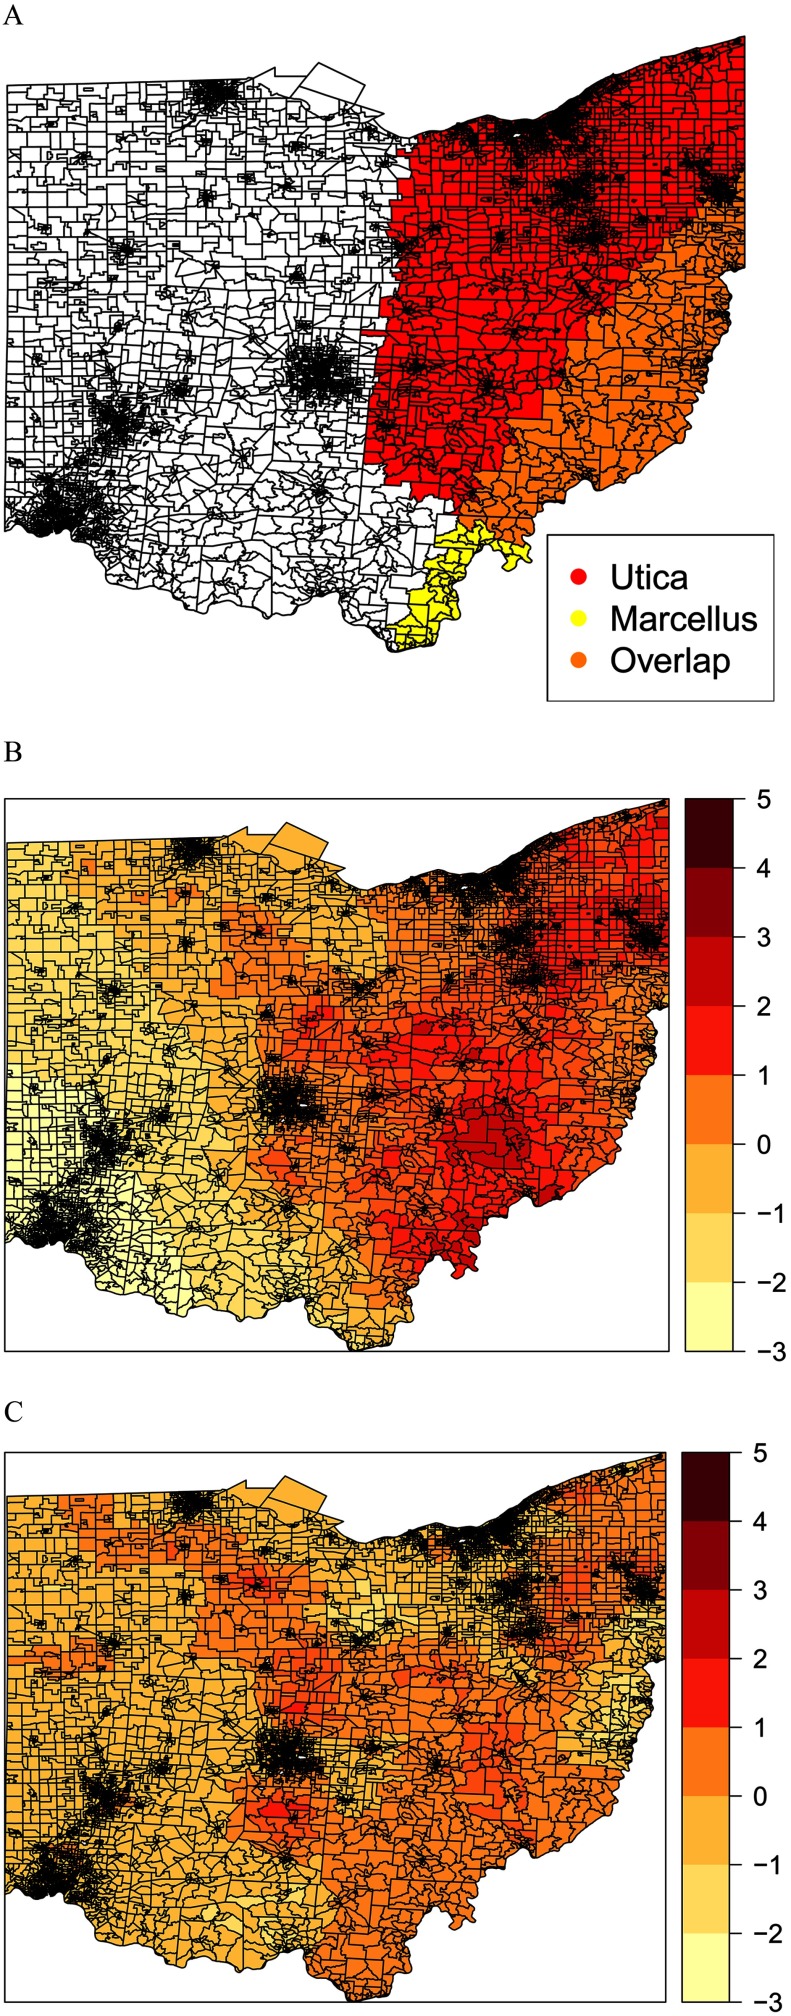
Figure 2.
Utica Shale, Marcellus Shale, and their (A) overlapping areas in Ohio; (B) posterior mean spatial random effects (magnitude and direction indicated by color gradation) from SGLMM; and (C) posterior mean spatial random effects (magnitude and direction indicated by color gradation) from Sparse SGLMM. Large positive random effect values represent elevated risk of CII injection well after adjustment for the considered predictors, whereas large negative values indicate the opposite. Images represent random effects from models of presence/absence of a CII injection well within a block group (dependent variable) against the following independent predictor variables: UNG wells, median age, % educated, % white only, % voter turnout, population density, and water area.

