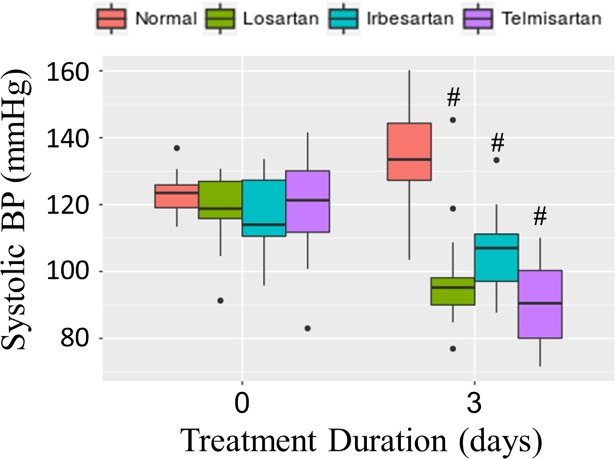
Fig 3. Systolic BP before and after treatment with ARBs for 3 days.
Systolic BP was measured before (day 0) and after (day 3) feeding mice chow containing losartan (n = 15, green), irbesartan (n = 15, blue) or telmisartan (n = 15, violet) at 2 g drug/kg chow, or normal chow (n = 8, orange) available ad libidum. Compared to mice fed normal chow, mice fed losartan, irbesartan or telmisartan chow had significantly lower BP (p < 10−4). Box plots show the median (thick line), first and third quatriles (lower and upper box sides), with vertical lines representing 5th and 95th percentiles. Data outside the 5th to 95th percentiles are shown as individual data points (black symbols).

