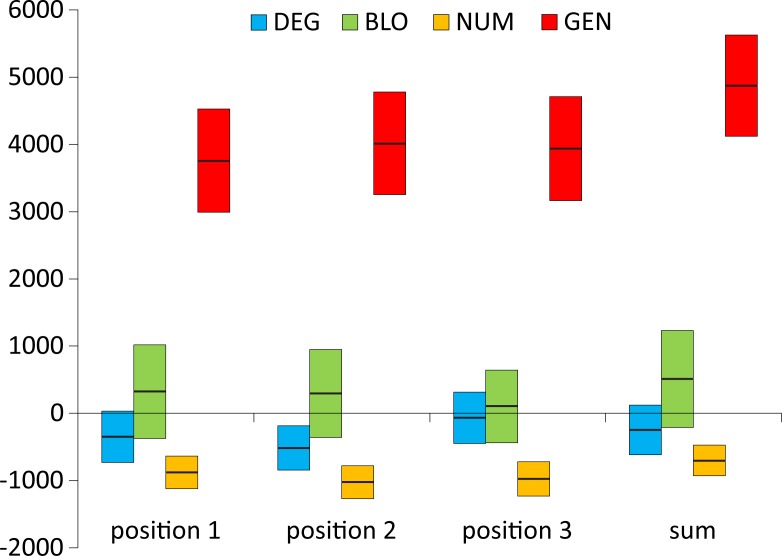
Fig 9. The difference , i.e., between the mean of the closest Euclidean distances of the randomized codes to the worst () and the best optimized codes (), calculated under four models with different restrictions on the genetic code structure when the polarity costs were minimized for the three codon positions individually or as the sum of costs over all positions; GEN, the least restrictive model; NUM, the model preserving the number of codons per amino acid; BLO, the model preserving the codon block structure; DEG, the model preserving the degeneracy.
The range of box plots corresponds to two standard deviations and the thick horizontal line marks the mean.

