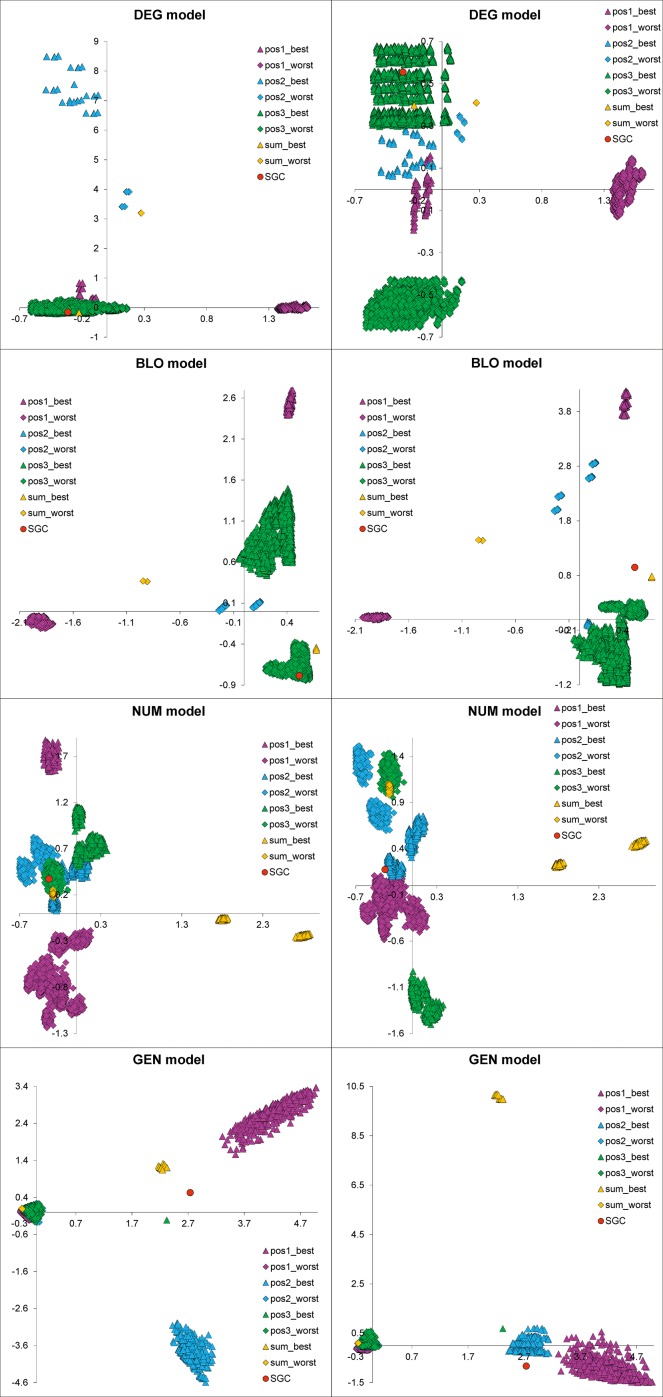
Fig 11.
The plots of correspondence analysis comparing the structures of the genetic codes for the first and second components (the left-hand panel) and the first and third components (the right-hand panel). The prefixes pos_1, pos_2, pos_3 and sum indicate that the given code was optimized to minimize (best) or maximize (worst) the objective function according to the amino acid replacement costs in the first, second, and third codon positions as well as the total costs for the three codon positions, respectively. The plots are shown separately for four models with different restrictions on the genetic code structure: GEN, the least restrictive model; NUM, the model preserving the number of codons per amino acid; BLO, the model preserving the codon block structure; DEG, the model preserving the degeneracy. See S18–S21 Figs for interactive plots.

