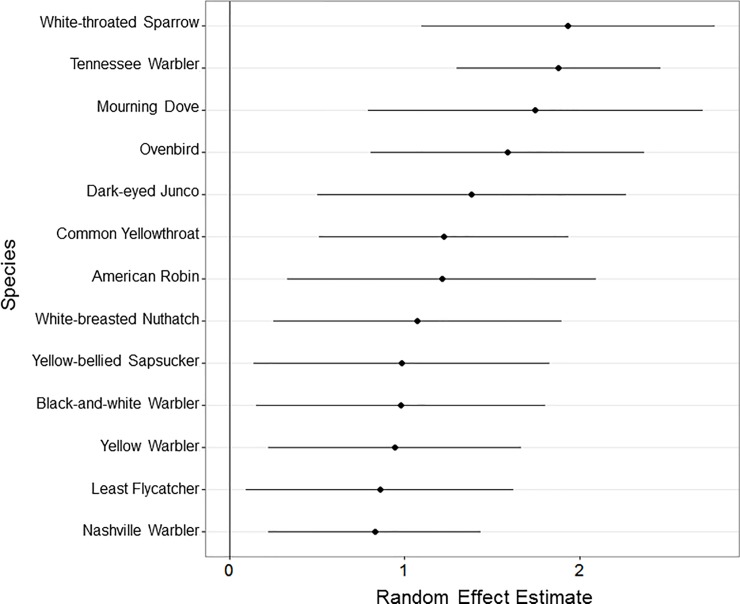
Fig 3. Caterpillar plot of the 13 supercollider species random effects estimates ± shrinkage estimates within the top model: Abundance+Timing+(1|Family/Genus/Species).
Random effect estimates indicate the estimated level of risk for each species after accounting for the effects of Abundance and Timing as approximated by the model. Shrinkage estimates are a measure of variance for the random effect estimates. Species were classified as supercolliders when random effect estimates – shrinkage estimates > 0, indicating high confidence in a non-zero estimate of risk of collisions greater than expected by Abundance and Timing alone. Within the supercolliding species, there is a clear gradient from highest risk, White-throated Sparrow (Zonotrichia albicollis) and Tennessee Warbler (Leiothlypis peregrine), to lower risk, Nashville Warbler (Leiothlypis ruficapilla) and Least Flycatcher (Empidonax minimus).

