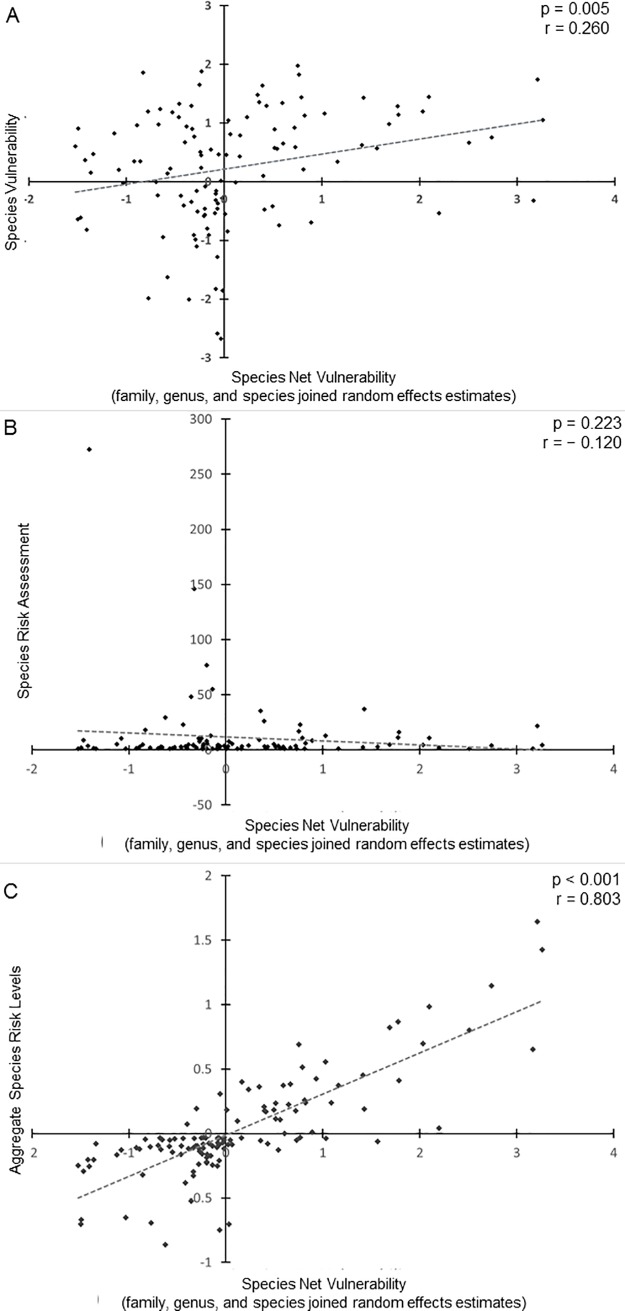
Fig 4. Scatterplots of correlations of previous species risk assessments with the species net vulnerabilities from our analysis.
P-value, Pearson product-moment correlation (r), and linear trendline shown for each graph. Relative abundance data for our analysis came from point counts conducted within 36 km of the location of collisions. Collision data came from daily monitoring of buildings along two highly urban routes within Minneapolis and St. Paul, MN, USA. (A) Species vulnerabilities calculated by Arnold and Zink [4] are weakly correlated with our species net vulnerabilities. Arnold and Zink used Partners in Flight estimates to determine relative abundances of species and used collision data from select buildings as well as communication towers for their analysis [4]. (B) Species risk assessment calculated by Loss et al. [2] was not correlated with our species net vulnerabilities. Loss et al. also used Breeding Bird Survey data to assess relative abundances of species but collision data came from building collisions in residential and urban areas throughout North America [2]. (C) Aggregate species risk levels (calculated by using our data and mimicking the Arnold and Zink analysis [4]) are strongly correlated with our species net vulnerabilities.

