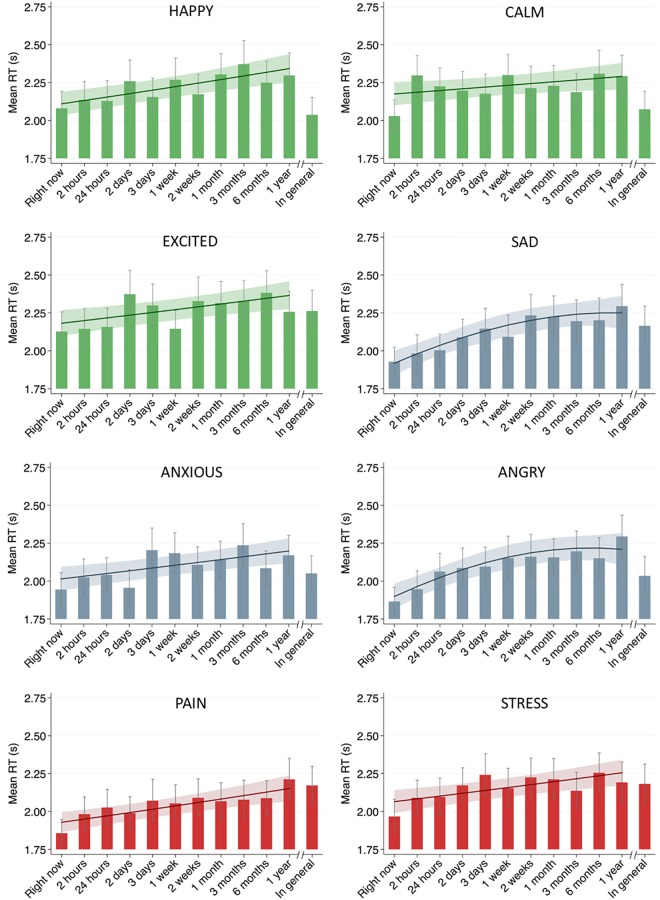
Fig 2. Effect of time frames on response times.
Response times (RT) are reported in seconds. Each bar represents mean response time in a given time frame. Each curve represents the change trajectory estimated from the best fitting model for each state. Whiskers and shaded area represent 95% confidence interval.

