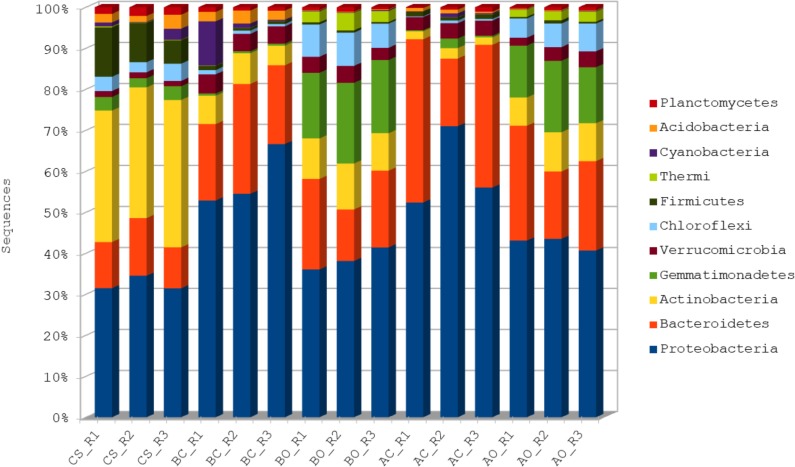
Fig 1. Phylum level distribution of microbial population across samples.
Phyla represented by at least 0.5% of the total assigned sequences (11 of total 36 phyla) are shown here. CS: Clean sandy soil; BC: Control oil contaminated bulk soil without barley plants; BO: Barley planted oil contaminated rhizosphere soil; AC: Control oil contaminated bulk soil without alfalfa plants; AO: Alfalfa planted oil contaminated rhizosphere soil.

