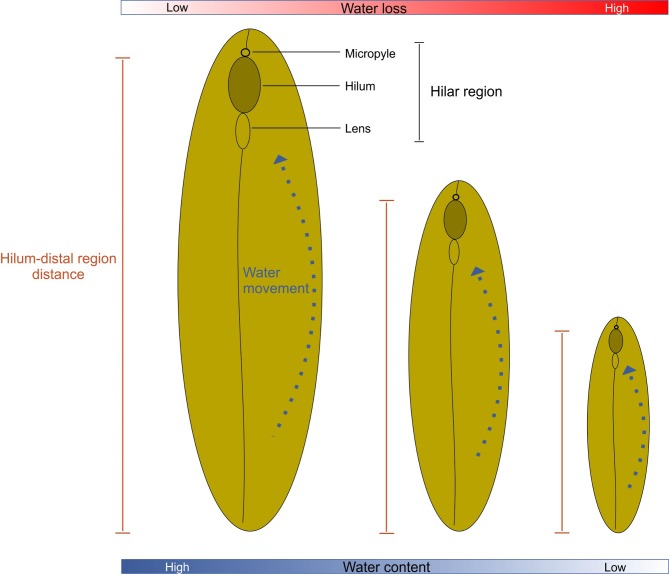
Fig 7. Conceptual model of differences in water loss during onset of PY in relation to seed size.
Blue dotted arrows indicate path of water inside the seed towards the hilar region. Red scale represents the variation in water loss among the sizes of seeds. Blue scale represents the variation in water content among the sizes of seeds.

