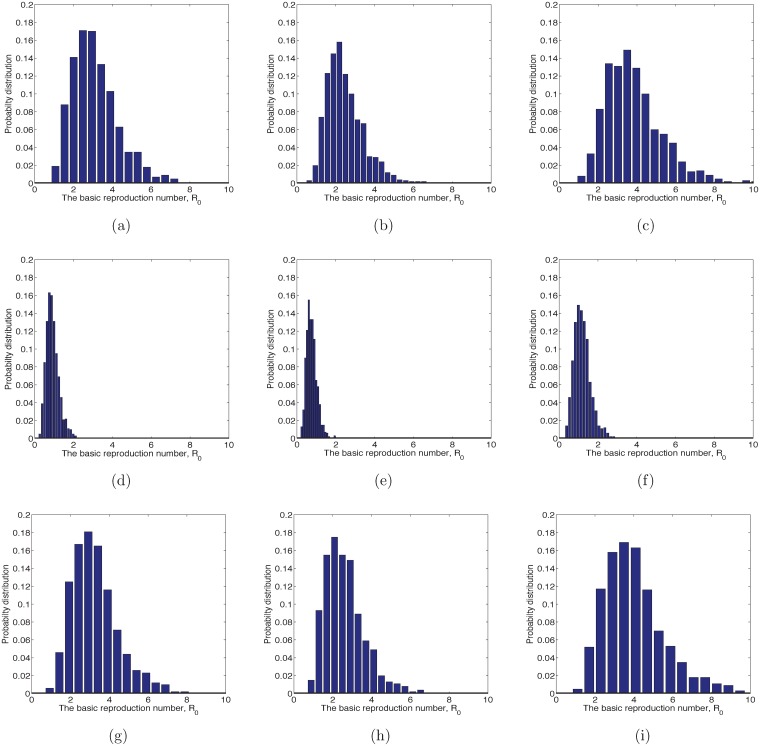
Fig 6. Histogram for .
Histograms from 1000 realizations of for DENV, ZIKV and CHIKV when Wolbachia-infected and Wolbachia-free Ae. aegypti mosquitoes. The baseline parameters in Table 2 were sampled from a triangular distribution having the mode at the baseline values and vanishing at the edges of the feasibility region. The mean and median of Zika are the largest. (a) When DENV is transmitted by wAlbB-infected mosquitoes, median and mean of are 2.94 and 3.13, respectively. (b) When DENV is transmitted by wMel-infected mosquitoes, median and mean of are 2.30 and 2.48, respectively. (c) When DENV is transmitted by Wolbachia-free mosquitoes, median and mean of are 3.65 and 3.84, respectively. (d) When CHIKV is transmitted by wAlbB-infected mosquitoes, median and mean of are 0.88 and 0.92, respectively. (e) When CHIKV is transmitted by wMel-infected mosquitoes, median and mean of are 0.73 and 0.76, respectively. (f) CHIKV transmitted by Wolbachia-free mosquitoes, median and mean of are 1.14 and 1.19, respectively. (g) When ZIKV is transmitted by wAlbB-infected mosquitoes, median and mean of are 3.10 and 3.28, respectively. (h) When ZIKV is transmitted by wMel-infected mosquitoes, median and mean of are 2.45 and 2.62, respectively. (i) When ZIKV is transmitted by Wolbachia-free mosquitoes, median and mean of are 3.79 and 4.03, respectively.

