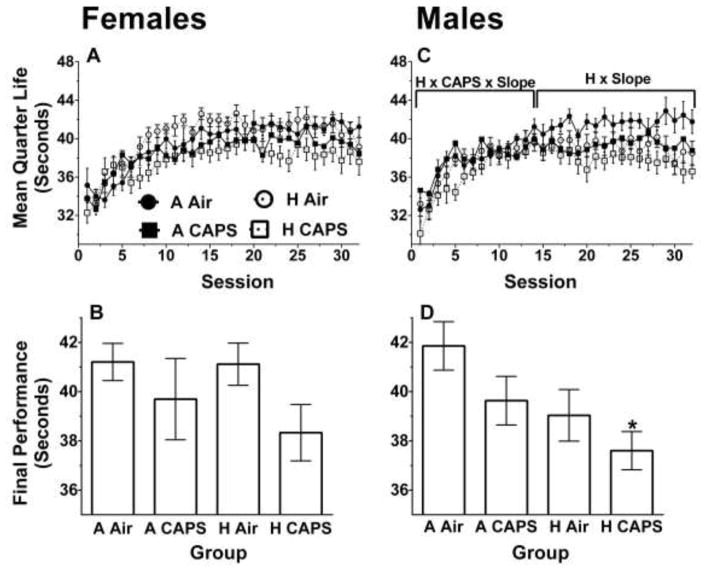
Figure 4.
FI60 mean quarter life and average over last 10 Sessions for females (A, B, n= 9–10/treatment group) and for males (C, D, n =10/treatment group). Data are reported as mean quarter life for each bin or session ± SE. A linear mixed-model was used to assess for hyperoxia and CAPS differences with significance being defined as p ≤ 0.05. H and CAPS indicate a significant effect of neonatal hyperoxia or CAPS exposure respectively on the average mean quarter life performance while H x Slope or CAPS x Slope are significant effects of hyperoxia or CAPS on learning rate. H x CAPS x Slope, indicate a significant interaction between hyperoxia, and CAPS on learning rate. The brackets indicate the period in which the significant difference was present. * indicates p ≤ 0.05 when compared to A Air alone with Tukey post-hoc.

