
Figure 2.
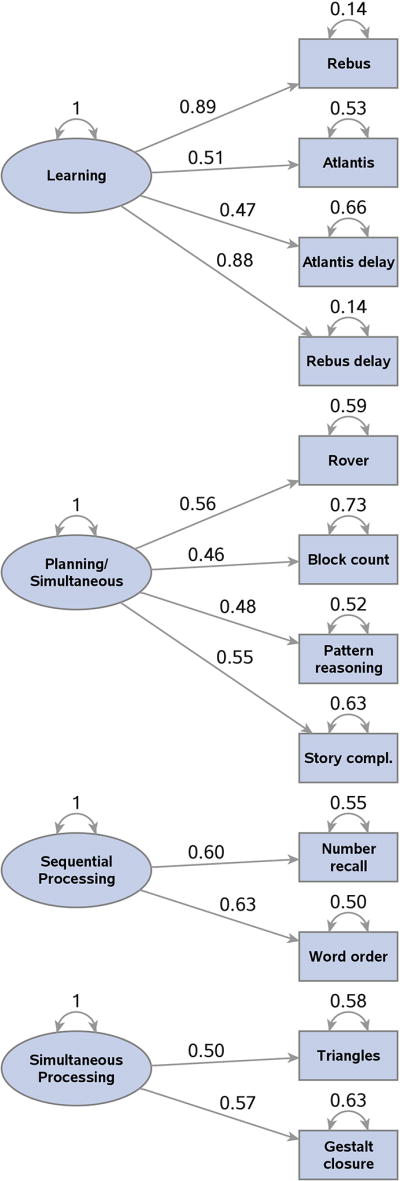
Factors and factor loadings for the exploratory factor analysis of scaled KABC items for all study participants.
Note: Factor loadings are only shown if 0.40 or over. The values by the curved arrowed lines indicate factor and error variance estimates. Factor variances are scaled to the value “1”. Factor interpretations are noted in the oval shapes; in order of the amount of total variance explained, they are: Learning, Planning (with Simultaneous), Sequential and Simultaneous processing. Values by the straight arrowed lines indicate factor loadings, which represents the correlation of the specific factor with the indicated KABC item. The square of the factor loading indicates the proportion of variance for that item accounted for by the specific factor. For example, the correlation between the factor representing Learning and Rebus is 0.89. The amount of variance of Rebus accounted for by the Learning factor is (.89)2= 79%. Error variances for the item scores indicate the proportion of total variance that is unique and not explained by the four common factors. For example, for Block count, 73% of the total variance is unique to that variable while 27% is common to the four factors (refer to manuscript Table 5 for the communalities).