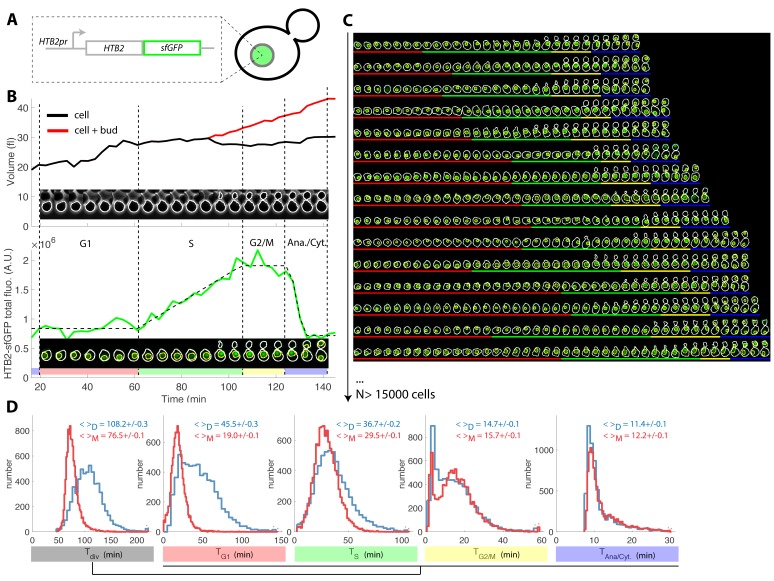
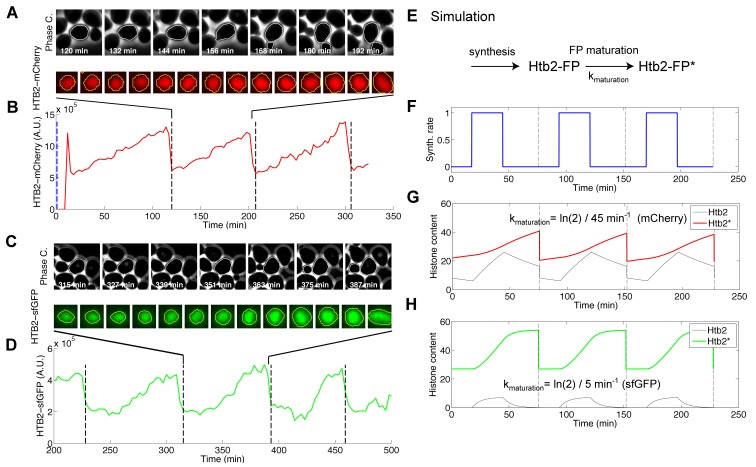
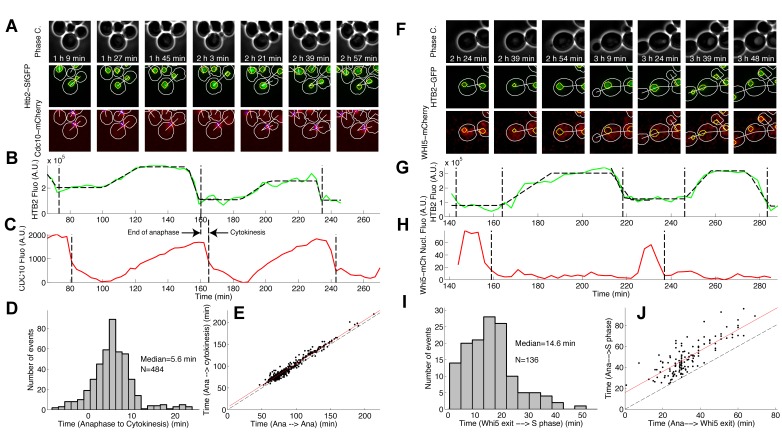
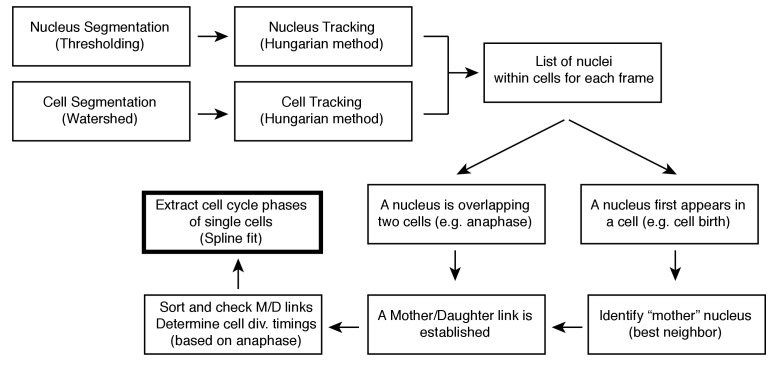
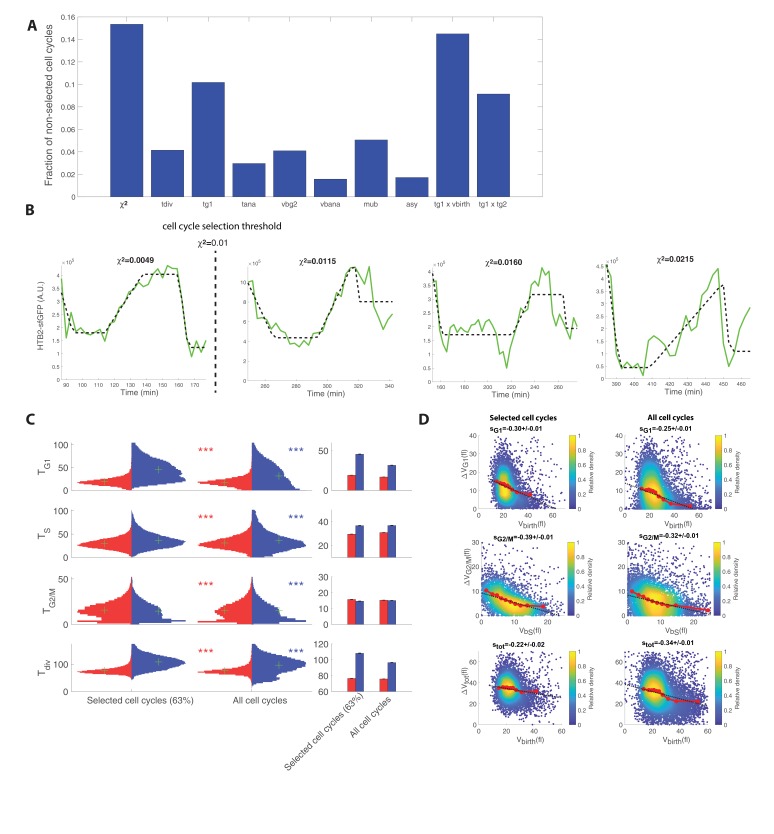
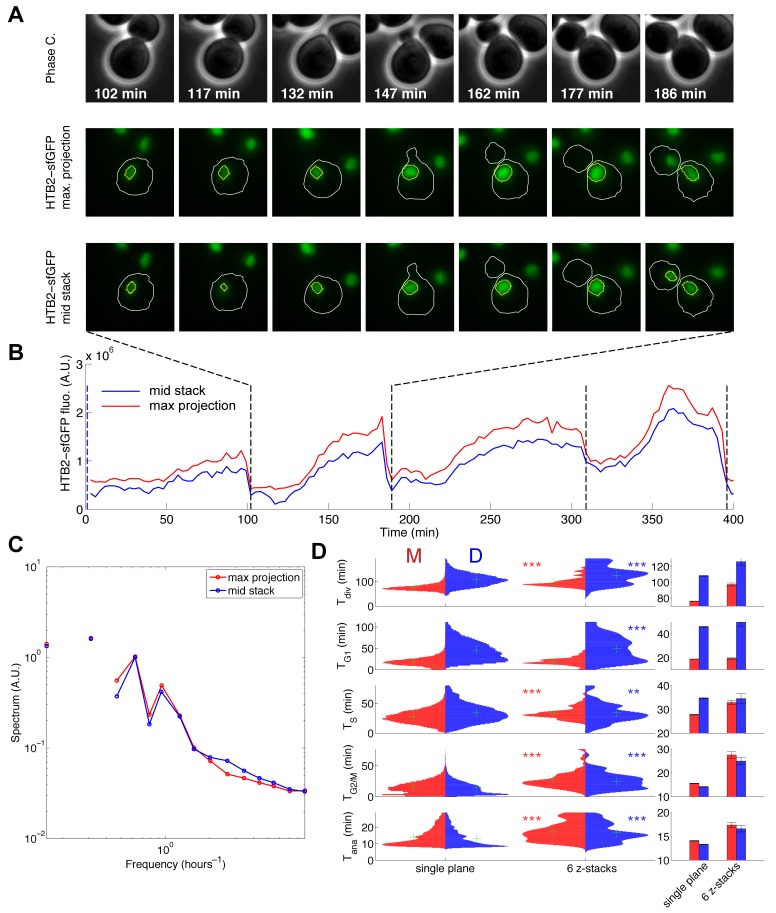
Figure 1. Tracking of cell cycle phases in individual cells.
(A) Principle of the H2B-GFP fluorescence marker used track cell cycle progression (B) Sequence of phase contrast (upper) and fluorescence (lower) images of a sample wild-type daughter cell carrying a histone marker (HTB2-sfGFP), displayed with a 6 min interval. Segmented cell and nuclear contours are indicated in white and yellow, respectively. The upper and bottom panels show the quantification of cell (and bud) volume and total fluorescence signal (green curve) over time, respectively. The dashed line shows the best fit of a piecewise linear model to the fluorescence signal, which is used to segment the cell cycle into distinct phases (see text for details), as indicated using a specific color code. Vertical dashed lines highlight cell cycle phase boundaries. (C) Sample dynamics of 15 individual daughter cells during one cell cycle. The green signal represents nuclear fluorescence of the HTB2-sfGFP marker. White and yellow lines indicate cellular and nuclear contours, respectively. Colored segments (G1, red; S, green; G2/M, yellow; anaphase/cytokinesis, blue) indicate cell cycle intervals, as determined using the procedure described in (B); (D) Histogram of durations of cell cycle intervals and overall cell cycle for WT daughter (D; N = 6079) and mother (M; N = 10775) cells. The legend indicates the mean ±standard error on mean.

