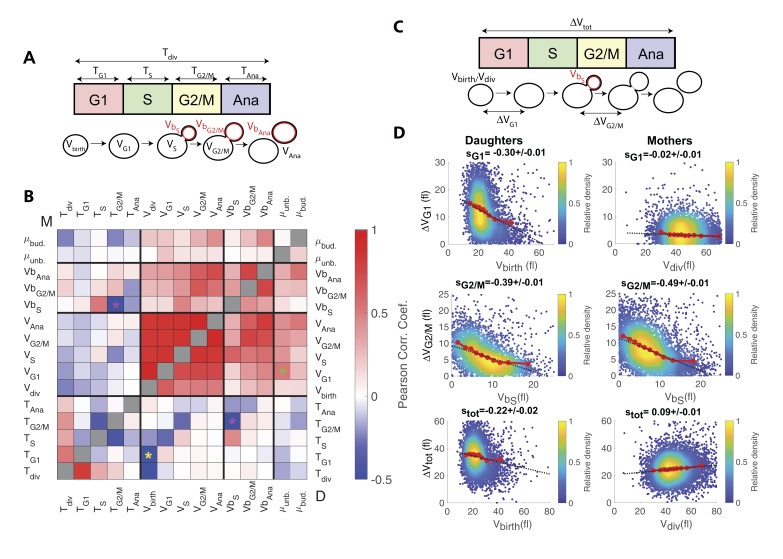
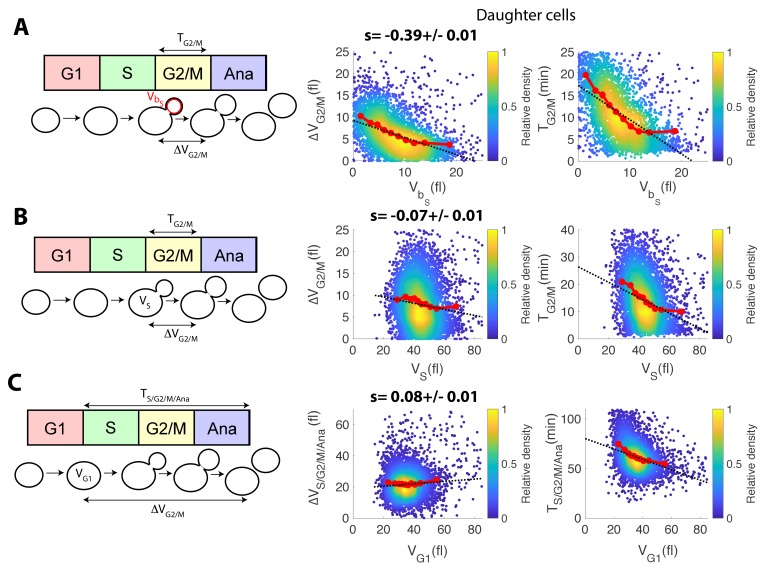
Figure 3. Identification and measurement of size compensation mechanisms in WT.
(A) Top: Schematic of cell cycle phases and definitions of variables used in the correlogram in panel (B). (B) Correlogram that represents Pearson’s correlation coefficient obtained from the scatter plot associated with the two variables. As indicated on the color scale, blue indicates a negative correlation and therefore highlights the presence of a potential compensatory mechanism, whereas red indicates a positive correlation. T indicates the duration (min) of each cell cycle phase; V and Vb indicate the mother and bud volumes at each cell cycle phase, respectively. μunb and μbud are the linear growth rate during the unbudded and budded period of the cell cycle, respectively. Ana indicates anaphase to cytokinesis interval. M (top left triangle) and D (bottom right triangle) represent the analyses performed in mother and daughter cells, respectively. Colored asterisks indicate squares of specific interest (see Main text). (C) Schematic of cell cycle phases and definitions of variables used in the scatter plots below. (D) Scatter plots showing variations in mother/bud volumes at the indicated cell cycle stages. Color indicates point density, according to the indicated color code. Red line shows binning of the scatter plot along the x-axis. Dashed black line is a robust linear regression through the cloud of points, and the indicated slope (s) represents the strength of the size-compensation mechanism. Error bars represent a 95% confidence interval.


