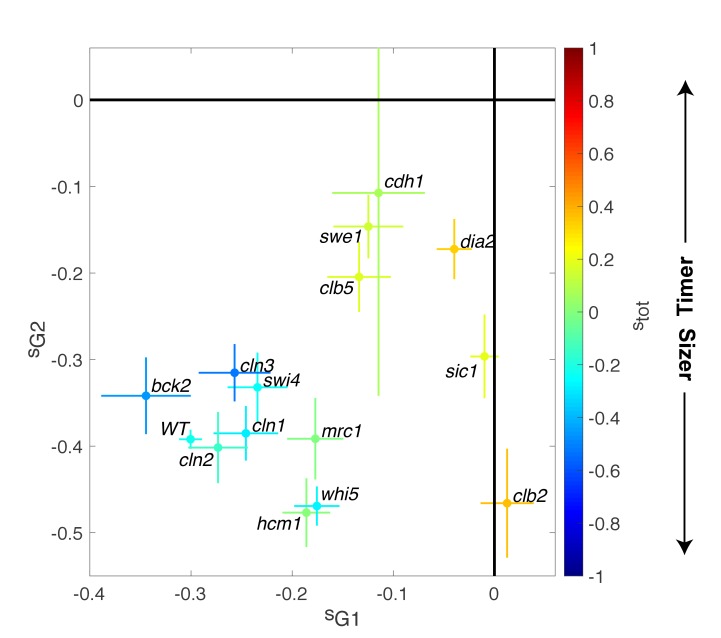
Figure 4. Magnitude of size compensation effects in cell cycle mutants.
Strength of size compensation during G1, G2/M, and the entire cell cycle in the indicated mutant backgrounds, calculated as described in Figure 3D. The cross color indicates the overall compensation size during the entire cell cycle, as indicated by the color scale. Values of −1 and +1 correspond to an ideal Sizer and Timer, respectively. Error bars represent a 95% confidence interval obtained from robust linear regression.

