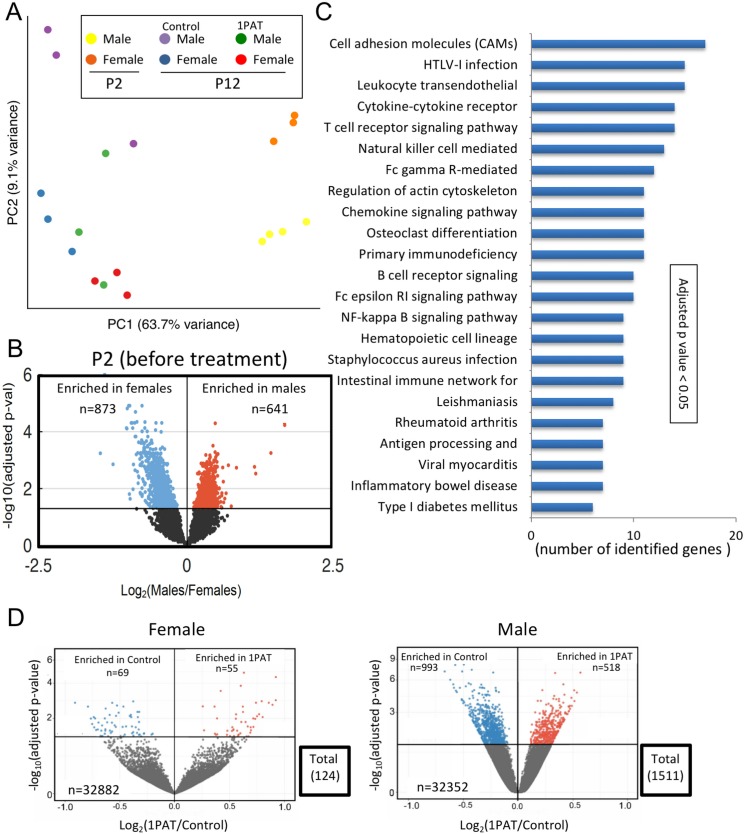
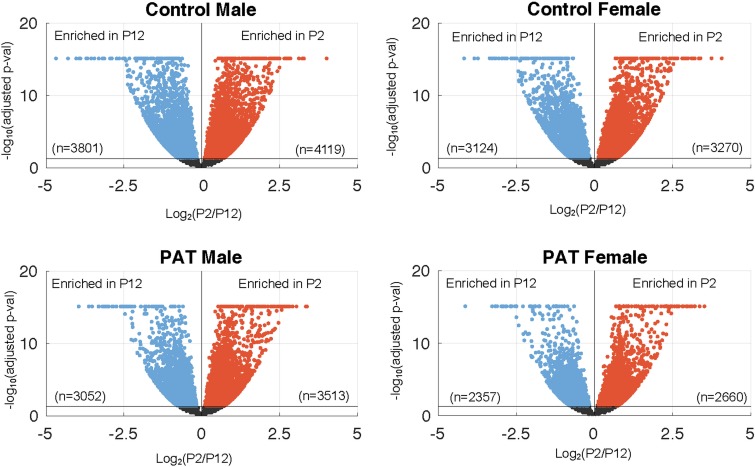
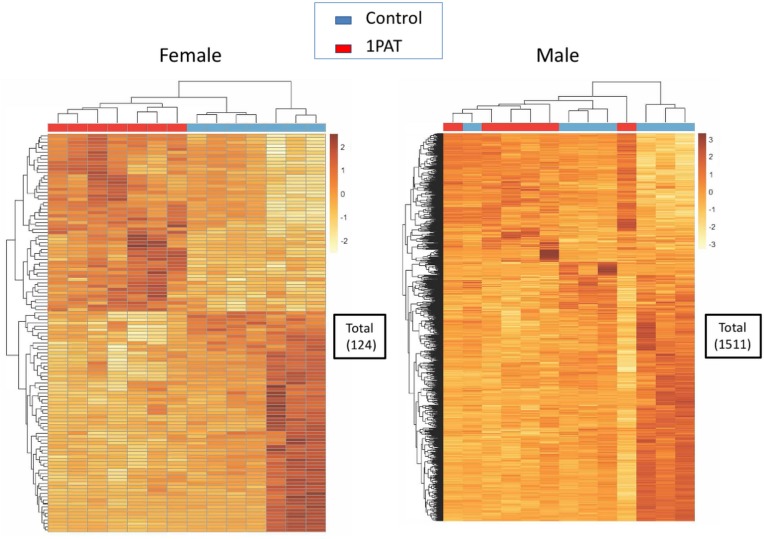
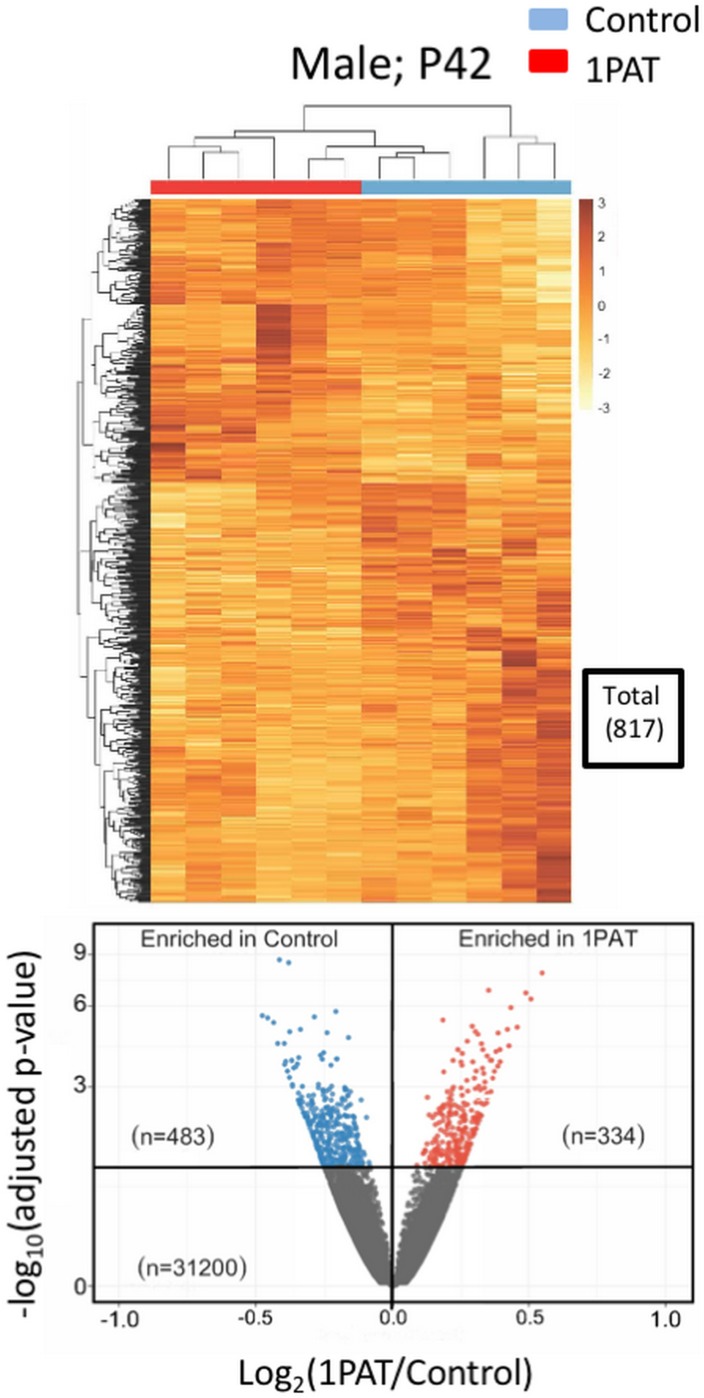
Figure 4. 1PAT effects on ileal gene expression from P2 to P23, based on RNA-Seq analysis.
(A) Bray-Curtis analysis of ileal gene expression of pups at P2 and P12 (2 days after PAT), represented by PCA. All differences between expression at P2 and P12 (in both 1PAT and control mice) were significant in both males and females (p<0.05). (B) Differential ileal gene expression between P2 males and females; volcano plot indicates 1514 genes with significantly different expression. DESeq2 difference visualization maximizes at 15 (-log10 (adjusted p values)). (C) Ileal KEGG pathways altered by 1PAT in P12 males; 23 significant pathways (adjusted p<0.05, after Benjamini-Hochberg correction), bars indicate numbers of differentially affected genes/pathway. (D) Differential ileal gene expression in 1PAT and control P23 females (left) and males (right) shown by volcano plot. In females, 124 genes (55 up-, 69 down-), and in males, 1511 genes (518 up-, 993 down-) were significantly differentially expressed, a 12.2-fold difference between the sexes. n = 4, 3, and 6–7 mice per group, at P2, P12, and P23, respectively. [See also Figure 4—figure supplements 1–3, and Supplementary files 3 and 4].


