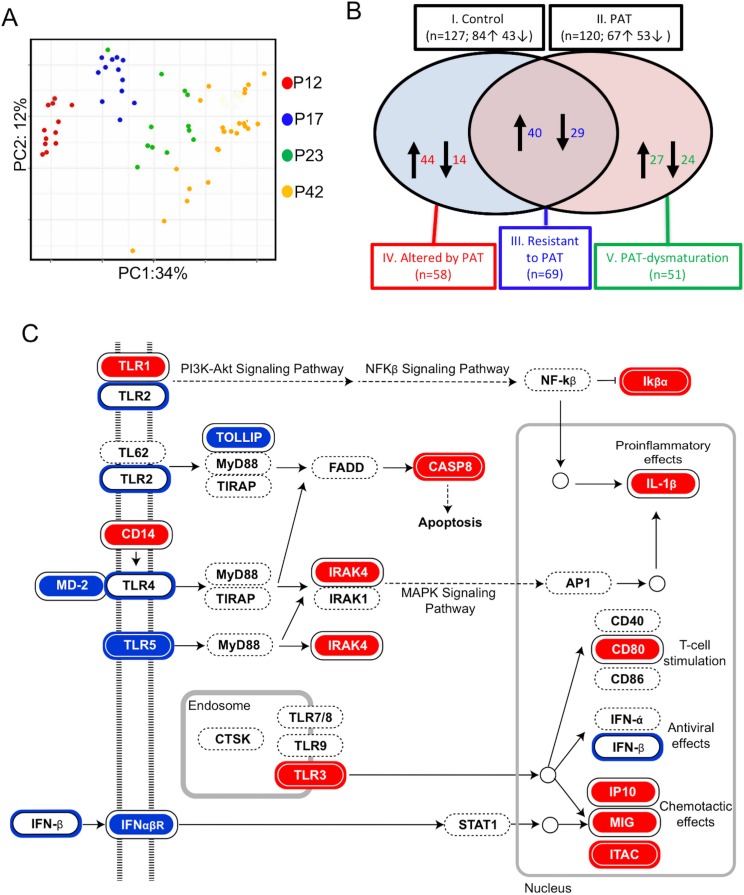
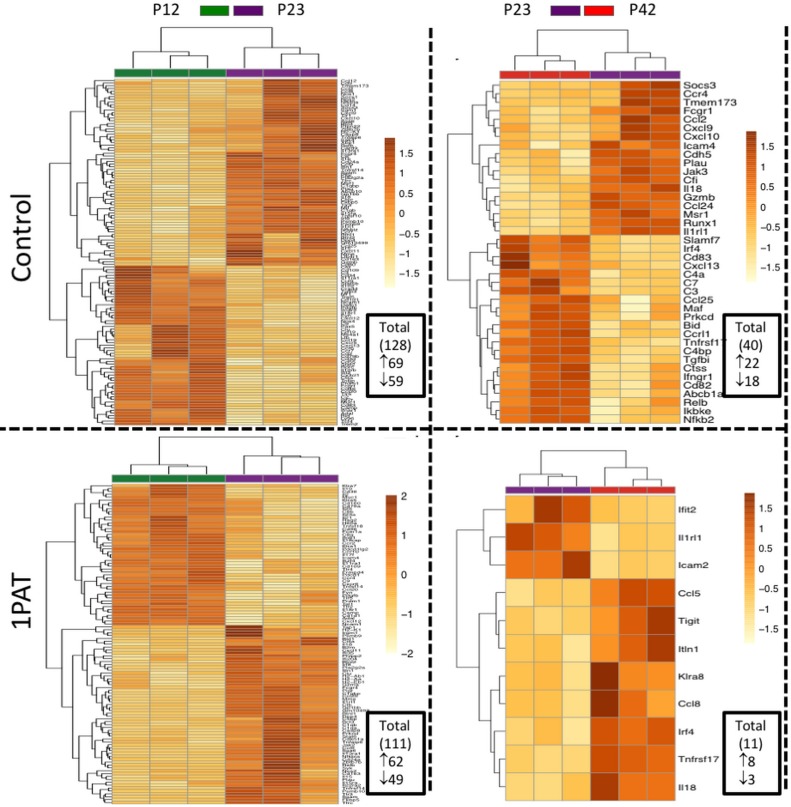
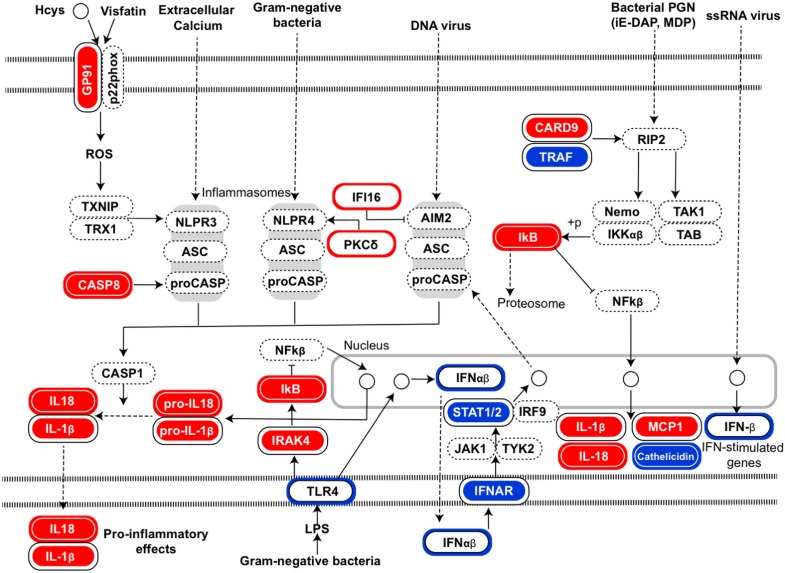
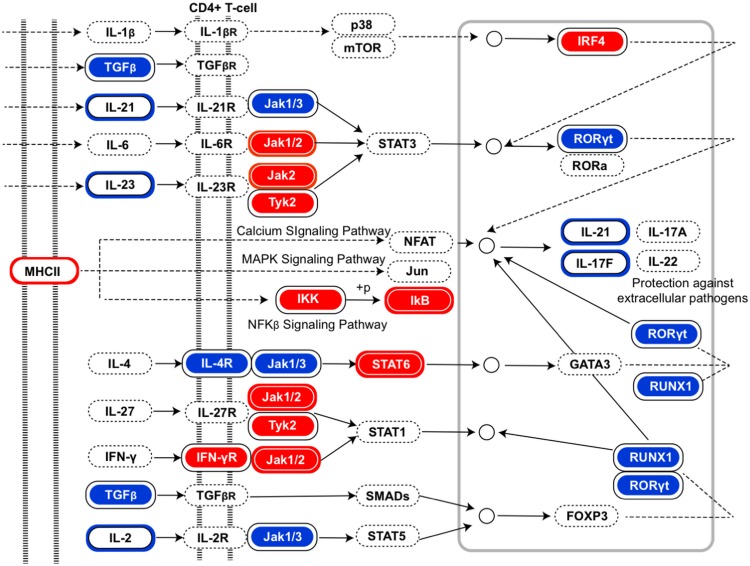
Figure 5. 1PAT effects on ileal immune gene expression in NOD mice, as evaluated by NanoString.
(A) Bray-Curtis analysis of ileal gene expression of pups, over time (P12, P17, P23 and P42). (B) Comparison of ileal gene expression in1PAT and Control NOD males, defining five classes of genes maturing between P12 and P42. I. Maturing in Control mice; II. Maturing in 1PAT mice; III. Maturation that is resistant to 1PAT; IV. Maturation that is altered by 1PAT; and V. Maturing exclusively in1PAT mice (dysmaturation). Arrows indicate direction of maturation of expression from P12 to P42, and number of genes affected. (C) Differences in Toll-like receptor signaling pathway genes between 1PAT and control males maturing from P12 to P23, based on KEGG pathway analysis. Boxes filled with blue indicate that gene expression significantly decreased in controls during maturation from P12 to P23; filled with red indicate significant increases; Blue and red circles indicate significant decreases or increases, respectively, in the 1PAT mice. Black circles indicate that the significant change in controls was lost in 1PAT mice. All significance testing performed by Fisher’s exact test with the Benjamini–Hochberg correction. [See also Figure 5—figure supplements 1–3].


