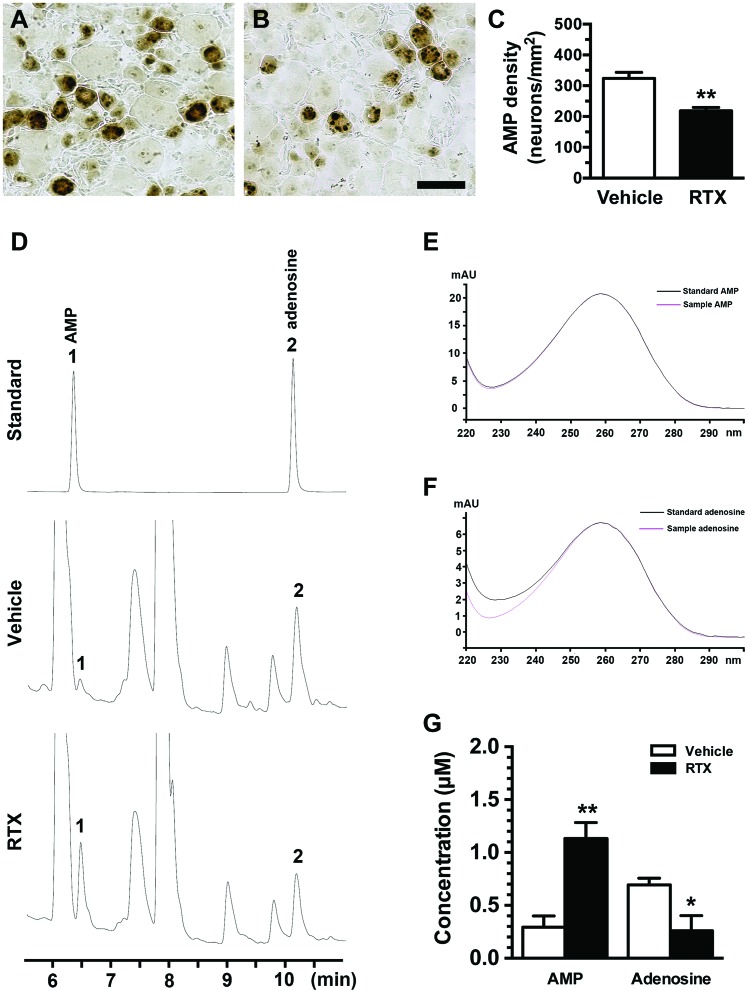
Figure 2.
Changes in prostatic acid phosphatase (PAP) ectonucleotidase activity and alterations of adenosine hydrolysis in resiniferatoxin (RTX) neuropathy. (A–C) Prostatic acid phosphatase ectonucleotidase activity was assessed through enzyme histochemistry using adenosine monophosphate (AMP, 3 mM) as a substrate. The reaction product was developed with 1% sodium sulfide and appeared dark brown in the dorsal root ganglion (DRG) sections of the vehicle (A) and day 7 after RTX neuropathy (RTX group) (B). (C) The graph shows AMP(+) neuronal densities in the vehicle (open bar, n = 5) and RTX (filled bar, n = 5) groups according to (A and B). (D–G) High-performance liquid chromatography (HPLC) was conducted to assess the change in the contents of adenosine and AMP, which were extracted from DRG. (D) This graph shows the HPLC chromatograms of the eluted standards (upper panel; AMP, 6.5 minutes; adenosine, 10.2 minutes), the vehicle group (middle panel), and the RTX group (bottom panel). Number designation on the chromatograms: 1 for AMP and 2 for adenosine. (E and F) These figures provide verification of the peaks for AMP (E) and adenosine (F) samples extracted from DRG tissues with respect to a spectral library. The absorbance spectra of the adenosine and AMP samples (pink line in E and F) were the same as the absorbance spectra of the adenosine standard (similarity index = 0.99) and the AMP standard (similarity index = 1.00) (black line in E and F). (G) A significant difference in adenosine signaling molecules was present between the vehicle (open bar, n = 6) and RTX groups (filled bar, n = 5) (ie, decreased adenosine and increased AMP). Elution time scale, minutes. *P < 0.05, **P < 0.01. Bar, 50 µm.

