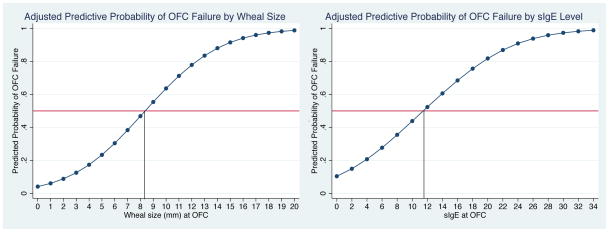
Figure 1. 50% Negative Predictive Values for OFC to Tree Nut Among Tree Nut Allergic and Sensitized Individuals.
50% negative predictive values for the combined allergic and sensitized population, adjusted for patient age, eczema, asthma, gender, and peanut allergy. Left panel displays wheal size curve, and right panel tree nut sIgE curve.

