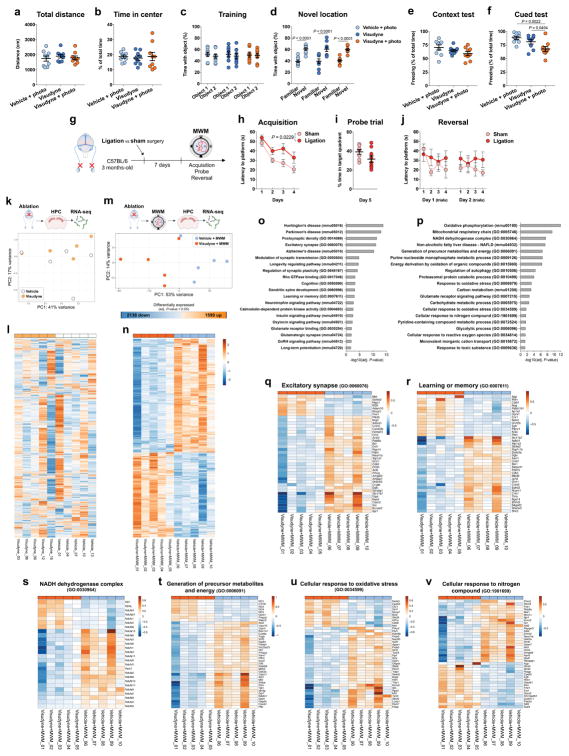
Extended Data Figure 5. Behavioral assessment and hippocampal RNA-seq analysis after impairing meningeal lymphatic function.
a, b, No differences in (a) total distance and in (b) time in center of the open field arena were observed between vehicle/photoconversion, Visudyne and Visudyne/photoconversion groups (mean ± s.e.m., n = 9 per group; one-way ANOVA with Bonferroni’s post-hoc test). c, d, Performance of mice from the 3 groups was also identical both in the (c) training and in the (d) novel location task of the novel location recognition paradigm (mean ± s.e.m., n = 9 per group; two-way ANOVA with Bonferroni’s post-hoc test). e, f, Mice performance in the contextual fear conditioning paradigm showed no differences between groups in the (e) context test, but a statistically significant difference in the (f) cued test (mean ± s.e.m., n = 9 per group; one-way ANOVA with Bonferroni’s post-hoc test). g, The cognitive performance of adult mice was assessed in the Morris water maze (MWM) test, one week after sham surgery or surgical ligation of the lymphatics afferent to the dCLNs. h–j, Ligated mice presented a significant increase in the (h) latency to platform during acquisition, when compared to sham-operated mice. No significant differences between groups were observed in the (i) % of time spent in the target quadrant in the probe trial or in the (j) reversal (mean ± s.e.m., n = 8 in sham, n = 9 in ligation; repeated measures two-way ANOVA with Bonferroni’s post-hoc test was used in h and j; two-tailed Mann-Whitney test was used in i). k, Vehicle or Visudyne injection with photoconversion were performed twice within two weeks interval. Total RNA was extracted from the hippocampus of mice from both groups and sequenced (RNA-seq). RNA-seq principal component (PC) analysis did not show a differential clustering of samples from vehicle and Visudyne groups. l, Heatmap showing relative expression levels of genes in vehicle/photoconversion and in Visudyne/photoconversion samples. m, After meningeal lymphatic ablation (twice within two weeks interval) and MWM performance, total RNA was extracted from the hippocampus of mice from vehicle/photoconversion or Visudyne/photoconversion groups and sequenced. RNA-seq principal component (PC) analysis demonstrating a differential clustering of samples from vehicle and Visudyne groups. A total of 2138 genes were down-regulated and 1599 genes were up-regulated in the hippocampus after meningeal lymphatic ablation and MWM performance. n, Heatmap showing relative expression levels of genes in vehicle/photoconversion and in Visudyne/photoconversion samples (color scale bar values represent standardized rlog-transformed values across samples for l and n). o, Neurological disease, neuronal activity and synaptic plasticity related GO and KEGG terms enriched upon Visudyne treatment, as measured by the –log10(adj. P-value). p, GO and KEGG terms related with metabolite generation and processing, glycolysis and mitochondrial respiration and oxidative stress that were enriched, as measured by the –log10(adj. P-value), upon Visudyne treatment and MWM performance. q, r, Heatmap showing relative expression levels of genes involved in two of the significantly altered GO terms related to (q) Excitatory synapse and (r) Learning or memory. s–v, Heatmaps showing relative expression levels of genes involved in four of the significantly altered GO terms related to (s) NADH dehydrogenase complex, (t) Generation of precursor metabolites and energy, (u) Cellular response to oxidative stress and (v) Cellular response to nitrogen compound. Datasets in k–v all consist of n = 5 per group; in k and m P-values were corrected for multiple hypothesis testing with the Benjamini–Hochberg false discovery rate procedure; in l and n–v functional enrichment of differential expressed genes was performed using gene sets from GO and KEGG and determined with Fisher’s exact test; color scale bar values in n and q–v represent standardized rlog-transformed values across samples.

