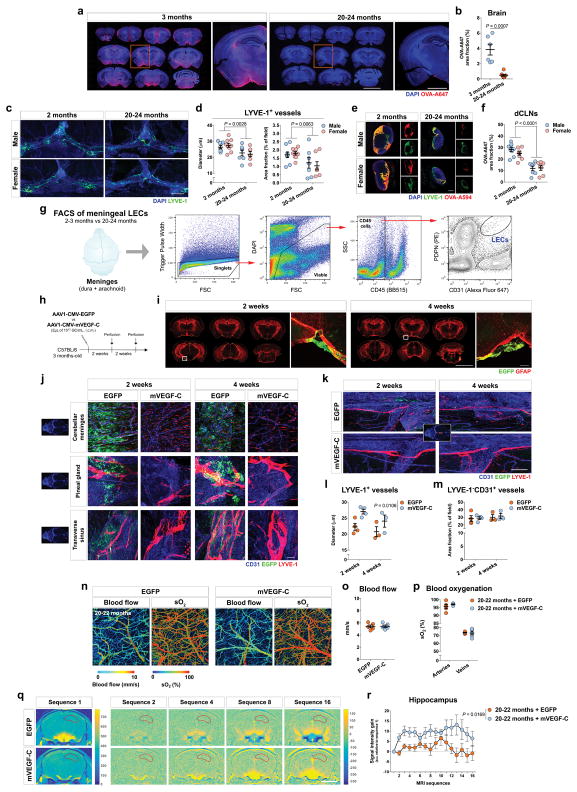
Extended Data Figure 6. Characterization of meningeal lymphatics in young and old mice and improvement of lymphatic function by viral-mediated expression of mVEGF-C.
a, OVA-A647 was injected into the CSF (i.c.m.) of young-adult (3 months of age) and old (20–24 months of age) mice. Representative brain sections stained with DAPI (blue) showing degree of OVA-A647 (red) influx into the parenchyma (scale bar, 5 mm; inset scale bar, 2 mm). b, Quantification of OVA-A647 area fraction (%) in brain sections (mean ± s.e.m., n = 6 in 3 months, n = 8 in 20–24 months; two-tailed Mann-Whitney test; representative of 2 independent experiments). c, Representative images of DAPI (blue) and LYVE-1 (green) staining in meningeal whole-mounts of young-adult (2 months-old) and old (20–24 months-old) male and female mice (scale bar, 1 mm). d, Measurement of LYVE-1+ vessel diameter and area fraction showed a significant decrease in both parameters in old mice, when compared to young-adults, in both females and males. e, Representative images of DAPI (blue) and LYVE-1 (green) staining in dCLNs 2 h after injection of OVA-A594 (red) into the CSF of young-adult and old mice from both genders (scale bar, 200 μm). f, Quantification of OVA-A594 area fraction (%) in the dCLNs of mice from different ages and genders showed a significant decrease in 20–24 months-old female and male mice. Data in d and f is presented as mean ± s.e.m., n = 9 per group at 2 months, n = 7 per group at 20–24 months for male and female; two-way ANOVA with Bonferroni’s post-hoc test was used in d and f; data was pooled from 2 independent experiments. g, Representative dot and contour plots showing the gating strategy used to isolate meningeal lymphatic endothelial cells (LECs) by fluorescence-activated cell sorting (FACS) from the meninges of young-adult and old mice (n = 3 per group, pooled from 2 independent experiments). h, Adult mice were injected i.c.m. with 2 μL of AAV1-CMV-EGFP (EGFP) or AAV1-CMV-mVEGF-C (mVEGF-C), both at 1013 genome copies (GC)/mL, and transcardially perfused with saline 2 or 4 weeks later. i, Representative brain coronal sections of mice showing EGFP+ infected cells (green) in the pia mater, surrounding the GFAP+ glia limitans (red) of the brain parenchyma, at 2 and 4 weeks post injection (scale bar, 5 mm; inset scale bar, 200 μm). j, Representative insets from meningeal whole-mounts stained for CD31 (blue), EGFP (green) and LYVE-1 (red; scale bar, 200 μm). Green cells are observed in the cerebellar meninges, pineal gland and transverse sinus in the EGFP group at 2 and 4 weeks, but not in the same regions of the meninges in the mVEGF-C group. k, Representative images of LYVE-1+ lymphatic vessels (red) and LYVE-1−CD31+ blood vessels (blue) in the superior sagittal sinus of mice treated with either EGFP or mVEGF-C, for 2 or 4 weeks (scale bar, 200 μm). l, m, Mice treated with AAV1 expressing mVEGF-C presented a significant increase in (l) lymphatic vessel diameter, but not in (m) coverage by blood vessels. Data in l and m is presented as mean ± s.e.m., n = 4 per group at 2 weeks, n = 3 per group at 4 weeks; two-way ANOVA with Bonferroni’s post-hoc test was used in l and m; data in h–m is representative of 2 independent experiments. n, Representative images of blood flow (mm/s) and arterial and venous blood oxygenation (% of sO2) readings obtained by Photoacoustic imaging of brain/meningeal vasculature of old mice (20–22 months-old) treated for 1 month with EGFP or mVEGF-C virus (both at 1013 GC/mL). o, p, The different treatments did not affect (n) blood flow or (p) blood oxygenation in the brain/meninges of old mice (mean ± s.e.m., n = 5 per group; two-tailed Mann-Whitney test was used in n and two-way ANOVA with Bonferroni’s post-hoc test was used in p; data results from a single experiment). q, Old mice (20–22 months-old) were injected i.c.m. with 2 μL of viral vectors expressing EGFP or mVEGF-C. One month later, T1-weighted MRI acquisition was performed after i.c.m. injection of 5 μL of gadolinium (25 mM in saline). Using the Lymph4D software, it was possible to measure the rate of contrast agent influx into the delineated brain hippocampal region of mice from both groups (scale bar, 3 mm). Images in sequence 2 and subsequent were obtained by subtraction of sequence 1. r, Quantification of the signal intensity gain (relative to sequence 1) in the hippocampus revealed a significant increase in the mVEGF-C group, when compared to EGFP (mean ± s.e.m., n = 4 per group; repeated measures two-way ANOVA with Bonferroni’s post-hoc; data was pooled from 2 independent experiments).

