Figure 1.
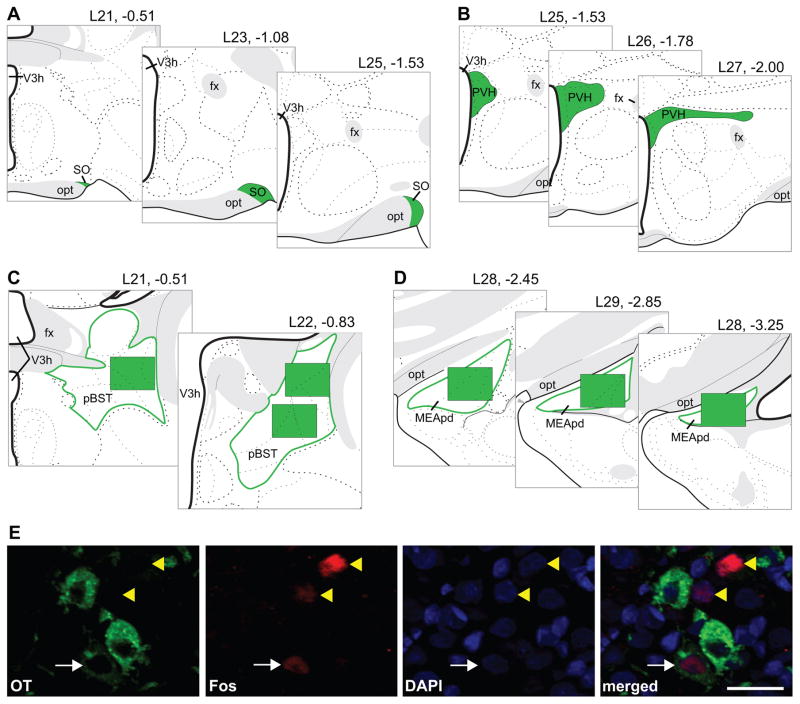
Representation of sampling locations shown on modified rat brain atlas templates (34) for the SO (A), PVH (B), pBST (C), and MEApd (D); headings refer to atlas level and distance in mm from bregma; green-filled areas refer to the analyzed locations. Example of analysis procedure (E) showing OT cytoplasmic labeling in green, Fos nuclear staining in red, and DAPI nuclear counterstain in blue. The number of double-labeled (white arrow) and single-labeled Fos-immunoreactive nuclei (yellow arrowheads) were counted. Scale bar = 25 μm, opt = optic tract, fx = fornix.

