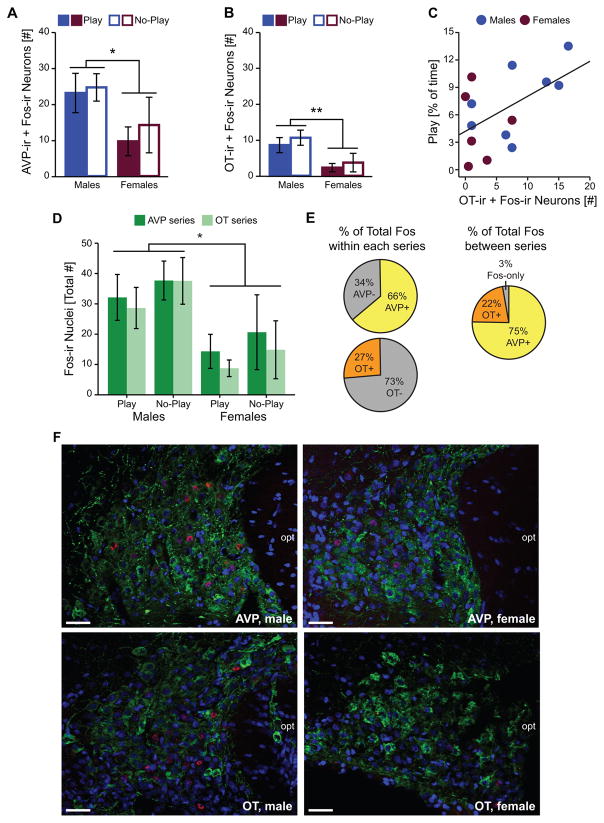
Figure 3.
Effects of play condition and sex on Fos induction within the SO. Fos induction within AVP-ir (A) and OT-ir (B) neurons. (C) Correlation between the time rats spent engaged in social play and Fos induction within OT-ir neurons. (D) Total SO Fos induction in AVP and OT tissue series. (E) Percent of total Fos induction that occurred within SO AVP-ir and SO OT-ir neurons within each series (left), and estimated between series (right). (F) Representative photomicrographs illustrate Fos induction (red), AVP-ir or OT-ir neurons (green), and the nuclear counterstain DAPI (blue). Bar graphs display mean ± SEM; *p < 0.05, **p < 0.01; opt = optic tract; scale bars = 50 μm.

