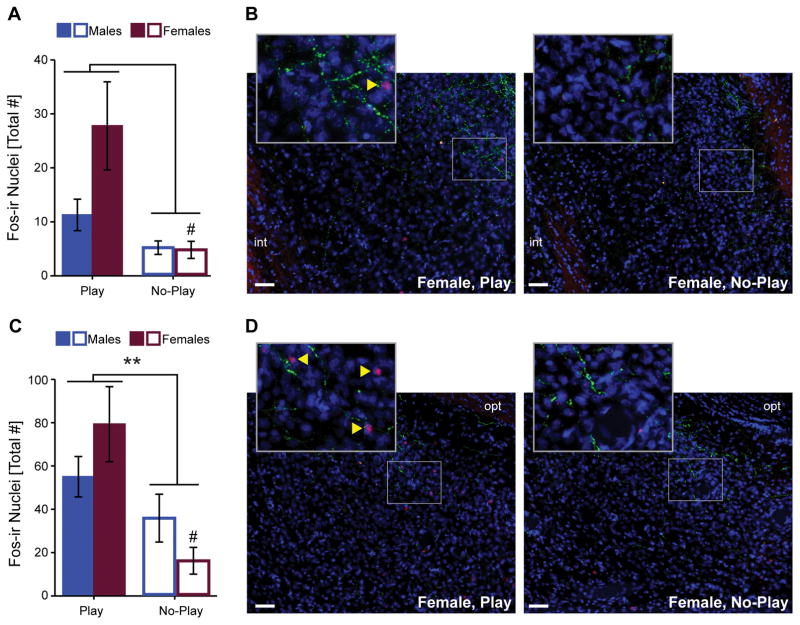
Figure 5.
Fos induction in pBST (A) and MEApd (C). Representative photomicrographs of pBST (B) and MEApd (D) illustrate Fos induction (red), AVP-ir fibers (green), and the nuclear counterstain DAPI (blue). Bar graphs displays mean ± SEM; yellow arrowheads on insets indicate Fos-ir nuclei; **p < 0.01; # p<0.05 between Play and No-Play groups of the same sex; int = internal capsule, opt = optic tract; scale bars = 50 μm.

