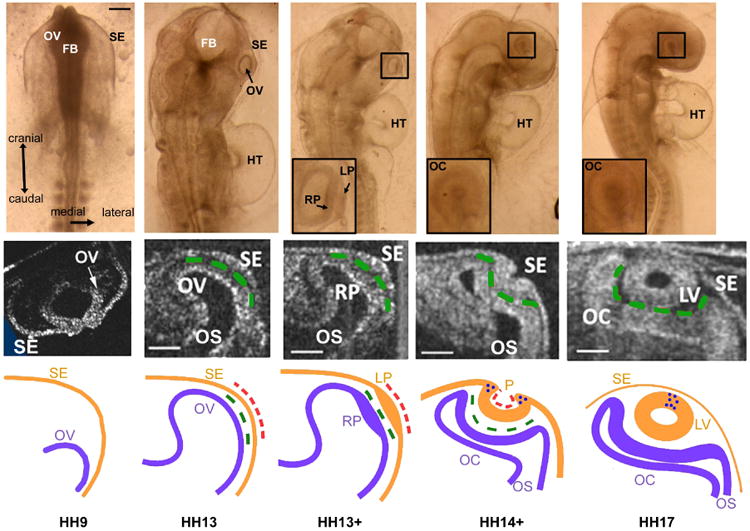
Figure 1.

Morphology of eye formation in chick embryo (stages HH9 to HH17). Top row: Brightfield images of embryo at stages indicted along bottom. Inserts show expanded view of eye within black boxes. Scale bar = 150 μm. Middle row: Representative OCT images of eye cross sections for each stage (cranial view). Scale bars = 100 μm. Bottom row: Schematic diagrams of eye cross sections for each stage. FB = forebrain; HT = heart tube; LP = lens placode; LV = lens vesicle; P = lens pit; OV = optic vesicle; OC = optic cup; OS = optic stalk; RP = retinal placode; SE = surface ectoderm; dashed green lines = extracellular matrix; dashed red lines = actomyosin contraction; blue dots = apoptosis. Except for HH9 OCT image, middle and bottom rows are reprinted from Oltean & Taber (2017) with modifications.
