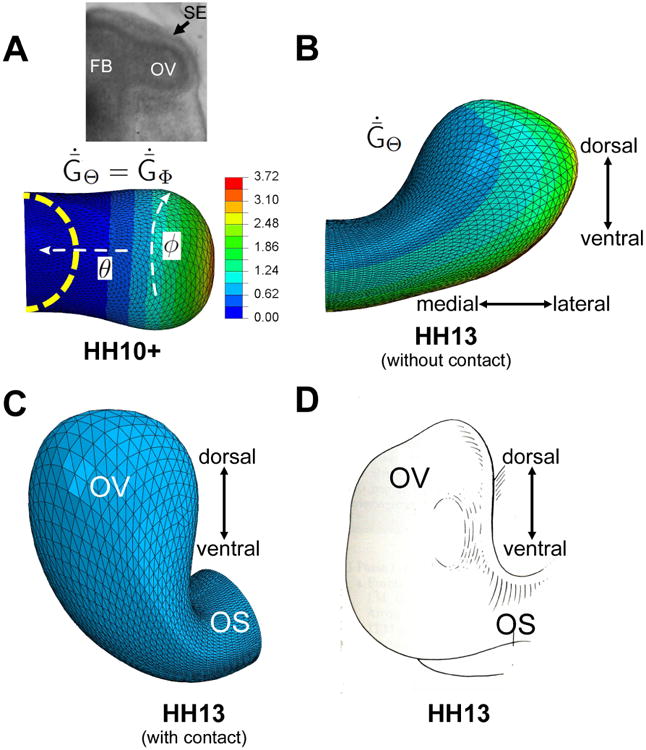
Figure 3.

Computational model for optic vesicle (OV) formation. (A) Growth pattern prior to contact with SE at stage HH10+ (dorsal view). Dashed yellow curve indicates initial shape at HH9. Colors represent nondimensional growth rate ( , ; see Eq. (5) in Appendix). Inset shows brightfield image of OV in HH10+ embryo. (B) Growth pattern fromHH10+ to HH13 ( ; see Eq. (6) in Appendix). Model is shown at HH13 with SE omitted to show unconstrained bending of OV. (C) Reoriented cranial view of model at HH13 with SE included (but not shown). (D) Schematic diagram of OV at same stage (reprinted with permission from Schook (1980b). FB = forebrain; OV = optic vesicle; OS = optic stalk; SE= surface ectoderm. 24
