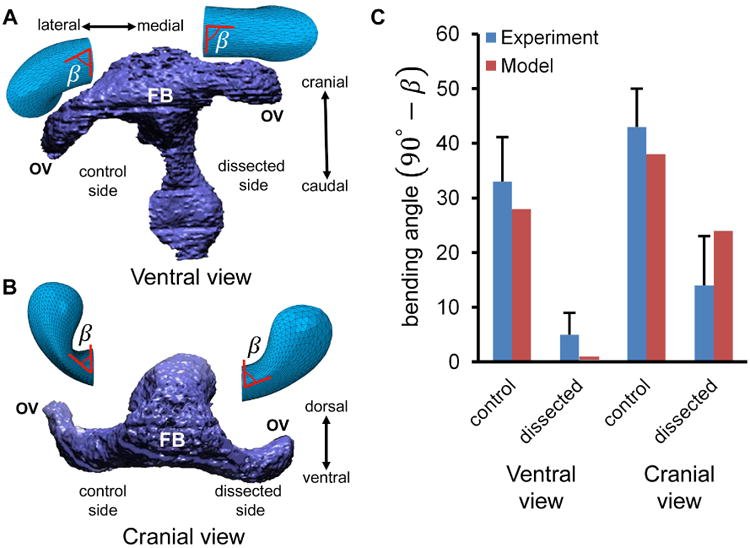
Figure 4.

Comparison of numerical and experimental results following removal of surface ectoderm (SE) at HH13. (A) 3-D reconstruction of embryo (ventral view) with SE dissected from one optic vesicle (OV). Model results are shown above both OVs with angle β indicated. (B) Same embryo and model (cranial view). (C) Plots of control and dissected bending angle (90° – β; mean ± s.d.). Embryo reconstructions in A and B are reprinted with permission from Hosseini et al. (2014), which also is the source of the experimental data. FB = forebrain
