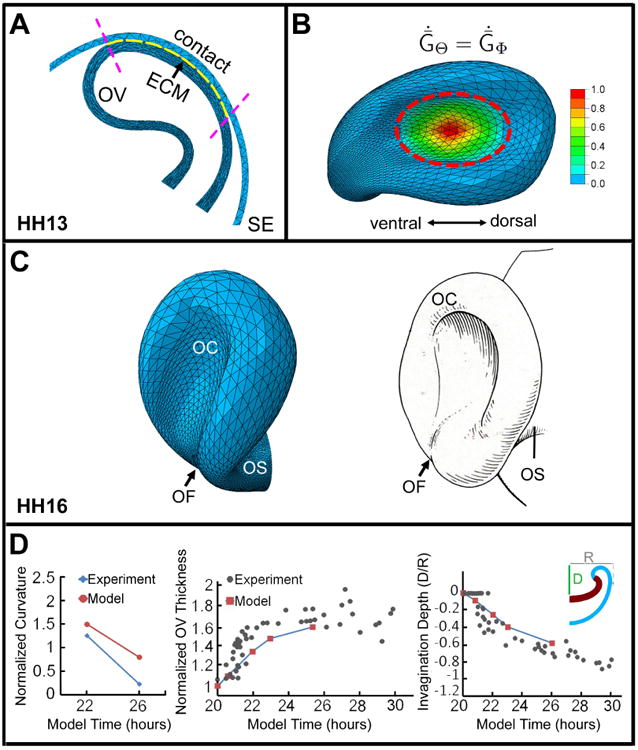
Figure 6.

Computational model for optic cup (OC) formation. (A) Cross section of model at stage HH13. Region of contact between optic vesicle (OV) and surface ectoderm (SE) (between purple dashed lines) defines location of ECM layer (yellow). (B) Model at HH16 showing growth pattern in OV during invagination phase. Colors represent nondimensional growth rate ( , ; see Eq. (7) in Appendix). (C) Comparison of model (left) and schematic of chick OV (right) at HH16. OS = optic stalk; OF = optic fissure. Schematic reprinted with permission from Schook (1980b). (D) Comparison of numerical and experimental results for OV geometry during invagination. Curvature, wall thickness, and invagination depth at the center of the forming OC are plotted versus time (normalized by their values at HH13). Experimental data are from Oltean et al. (2016)
