Figure 7.

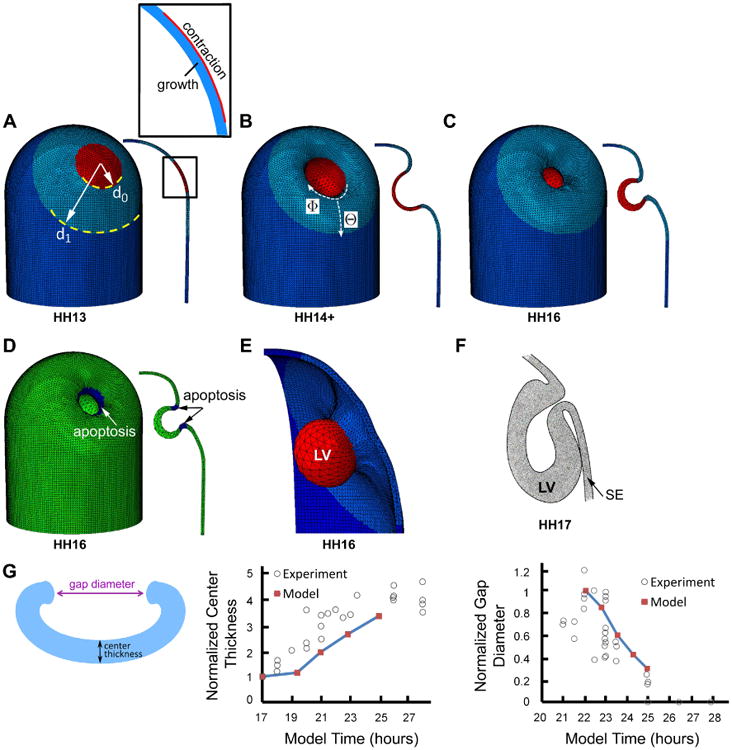
Computational model for lens vesicle (LV) formation. (A) Initial configuration of surface ectoderm (SE). Red, light blue, and dark blue colors, respectively, indicate invagination region, relatively soft surrounding annular region, and outer region with normal stiffness. Inset shows details of invaginating region (defined as circular region in contact with optic vesicle, see Fig. 6A), which consists of an inner growing layer (blue) and an outer contracting layer (red). (B, C) Model during (HH14+) and at end (HH16) of LV formation. (D) Model at HH16 with dark blue indicating region of apoptosis. Cross section is shown at right. (E) 3-D representation of lens vesicle in model at HH16. (F) Schematic diagram of forming chick lens at HH17. Reprinted with permission from Schook (1980a). (G) Comparison of numerical and experimental results for forming LV. Schematic shows measured quantities. Wall thickness at center of invaginating region (normalized by value at HH12) and average diameter of lens pit opening (normalized by value at HH14) are plotted versus time. Experimental data are from Oltean & Taber (2017).
