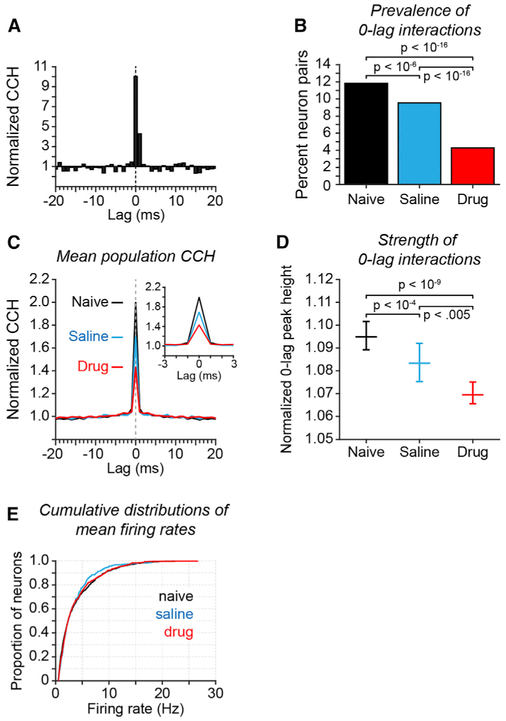
Figure 2. Influence of NMDAR Antagonist on Spike Synchrony in Prefrontal Cortex.
Results of cross-correlation analysis applied to the spike trains of pairs of simultaneously recorded prefrontal neurons. Experimental condition is indicated by color (B-E): drug-naive (black), saline (blue), and drug (red).
(A) Example CCH of a neuron pair recorded in the drug-naive condition with a significant CCH peak at 0-lag. The CCH is normalized by dividing counts in each bin in the original data by the mean count of the bootstrap distribution of spike-jittered CCHs at that bin.
(B) Proportion of all neuron pairs recorded that exhibited a significant peak at 0-lag (±1 ms). A neuron pair was considered to exhibit a significant 0-lag CCH peak if the sum of the counts of joint spikes at lags − 1,0, and +1 exceeded the 99th percentile of the distribution of corresponding sums computed from the spike-jittered CCHs. p values reflect significance of differences in proportion of significantly coupled neuron pairs across experimental conditions (Fisher’s exact test; n = 1,736/14,674, 469/4,908, and 518/12,112 significant pairs out of total for naive, saline, and drug, respectively).
(C) Mean population CCHs separated by experimental condition (insert shows the 0-lag peak of the same data on an expanded ±3 ms lag timescale). All recorded neuron pairs were included. CCH normalization as in (A).
(D) Median 0-lag CCH peak height as a function of experimental condition. For each neuron pair, 0-lag peak height was computed as the sum of joint spike counts in the −1, 0, and +1 lag bins of the original data and was normalized by dividing by the mean of the sum of counts in the same bins of the spike-jittered CCHs. Data plotted reflects the median of the distribution of normalized 0-lag peak heights across all recorded neuron pairs in each experimental condition (error bars reflect 95% confidence intervals of the median; p values calculated by Kruskal-Wallis test followed by Tukey’s HSD test).
(E) Cumulative distributions of mean firing rate by experimental condition. No significant differences in mean firing rate were found (Kruskal-Wallis test; saline versus drug, p = 0.99; naive versus drug, p = 0.90, saline versus drug p = 0.97).

