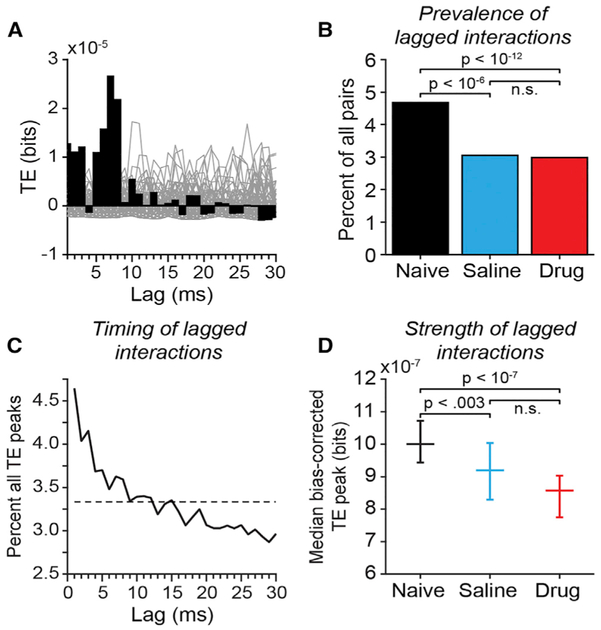
Figure 5. Transfer Entropy in Pairs of Simultaneously Recorded Prefrontal Neurons.
(A) Example bias-corrected transfer entropy (TE) function for a pair of prefrontal neurons recorded in the drug-Naive condition. For each neuron pair, TE values (black bars) in each lag bin were bias corrected by subtracting the mean at the corresponding lag bin of a bootstrap distribution of TE values obtained from the same neurons after randomly jittering all spike times within a± 30 ms window to destroy the temporal relationship between the spike trains (gray lines plot TE functions computed from spike jittered data).
(B) The proportion of all neuronal pairs recorded that were identified as significantly coupled by TE analysis separated by experimental condition. Neuron pairs were considered significantly coupled if the peak of the TE time course exceeded the 99.9th percentile of peaks in any lag bin in 1000 spike-jittered bootstrap iterations of the analysis. Neuron pairs (coupled/all): drug-naive: 677/14,468 pairs; saline: 150/4,914 pairs; drug: 365/12,230 pairs. p values reflecting the significance of differences between experimental conditions were calculated using Fisher’s exact test.
(C) Distribution of time bins (lags) in which peak TE values occurred, across all neuron pairs. Dashed line indicates the expected values if peak locations were uniformly distributed across lags.
(D) Median bias-corrected peak TE values across all neuron pairs (error bars reflect 95% confidence intervals of the median); p values reflecting the significance of differences between experimental conditions were calculated using the Kruskall-Wallis test followed by Tukey’s HSD test.

