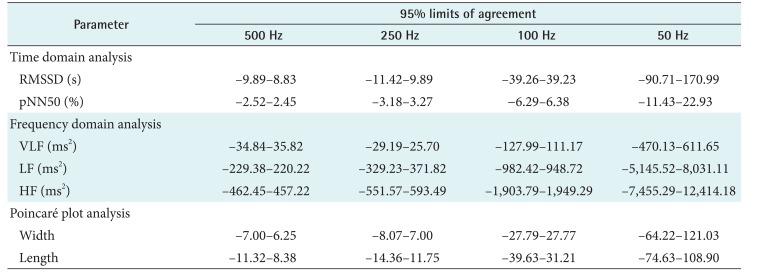
Table 3. Results of Bland-Altman plot analysis summarized as percentage differences from 95% limits of agreement of heart rate variability parameters from down-sampled ECGs in comparison with parameters from 1,000-Hz original ECG.
ECG: electrocardiogram, RMSSD: root-mean-squared successive differences, pNN50: proportion of NN50 to total number of R–R intervals, VLF: power of very low frequency, LF: power of low frequency, HF: power of high frequency.

