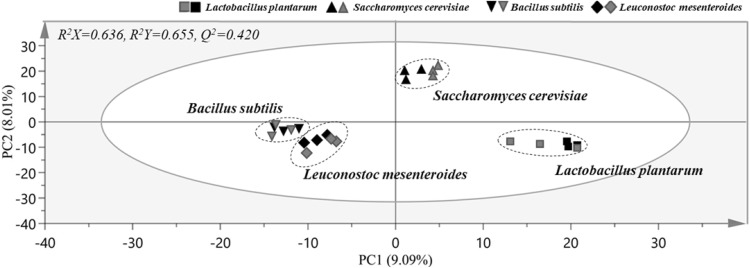
Fig. 4.
Orthogonal projections to latent structures discriminant analysis (OPLS-DA) score plot derived from GC–MS data of pileus and stipe of Sparassis crispa fermented with different microbial strains, showing clear metabolic differences among groups fermented with identical strains. The OPLS-DA model was generated with two predictive components and three orthogonal components. The OPLS-DA model was validated by permutation test with 200 random permutations. Symbols with black and red color denote fermented pileus and stipe of S. crispa, respectively. (Color figure online)

