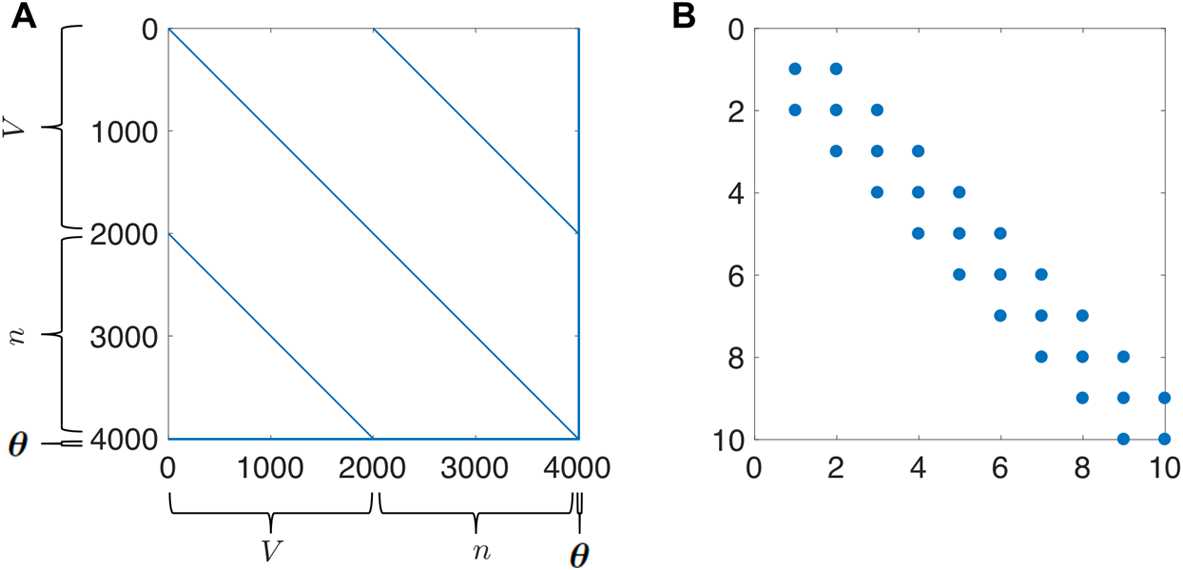
Fig. 13.

(A) Sparsity pattern for the Hessian of the cost function for the Morris–Lecar equations for time points. The final eight rows (and symmetrically the last eight columns) depict how the states at each time depend upon the parameters. (B) The top left corner of the Hessian shown in (A)
