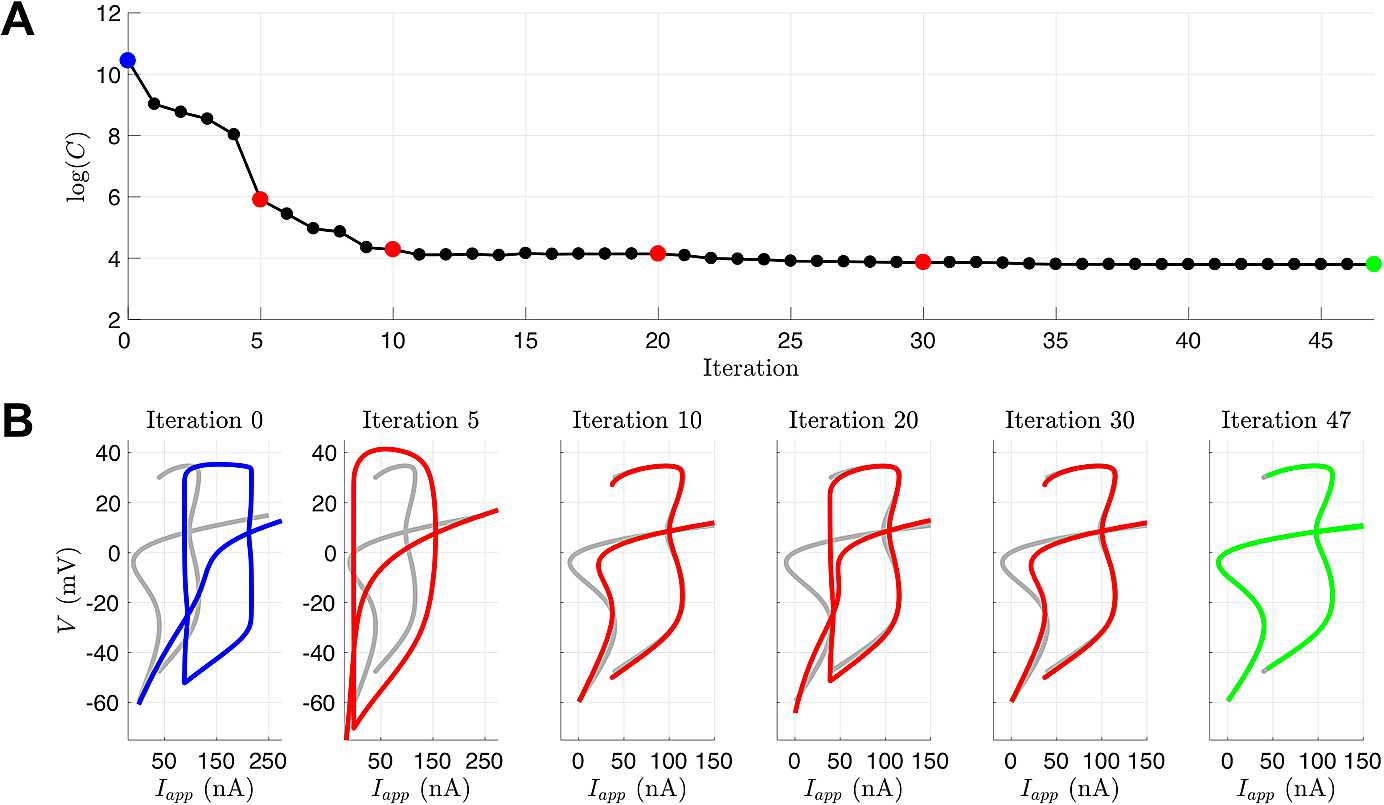
Fig. 14.

(A) Logarithm of the value of the cost function for a twin experiment initialized with parameters from the Hopf regime but observational data from the SNIC regime. The iterates were generated from fmincon with provided Hessian and gradient functions. (B) Bifurcation diagrams produced from parameter estimates for selected iterations. The blue is the initial bifurcation structure, the gray is the true bifurcation structure for the parameters that generated the observed data, the red is the bifurcation structure of the iterates, and the green is the bifurcation structure of the optimal point determined by fmincon
