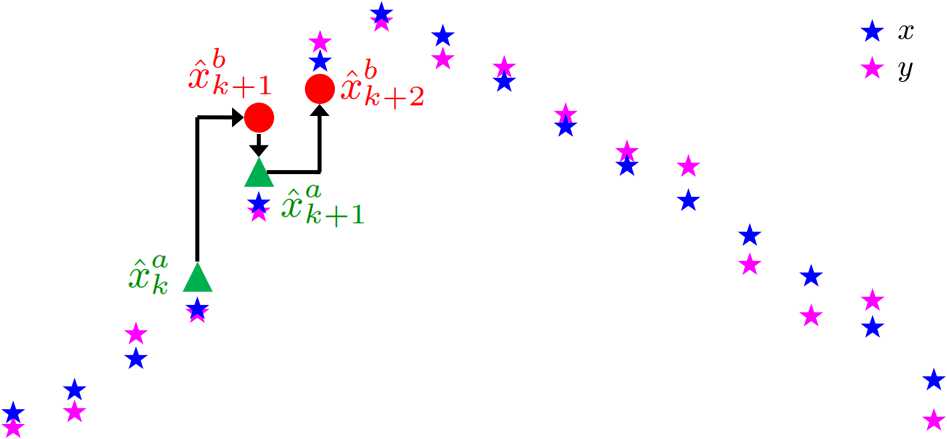
Fig. 2.

Example of iterative estimation in UKF. The red circles are the result of forward integration through the model using the previous best estimates. The green are the estimates after combining these with observational data. The blue stars depict the true system output (without any noise), and the magenta stars are the noisy observational data with noise generated by (48) and
