Figure 6.
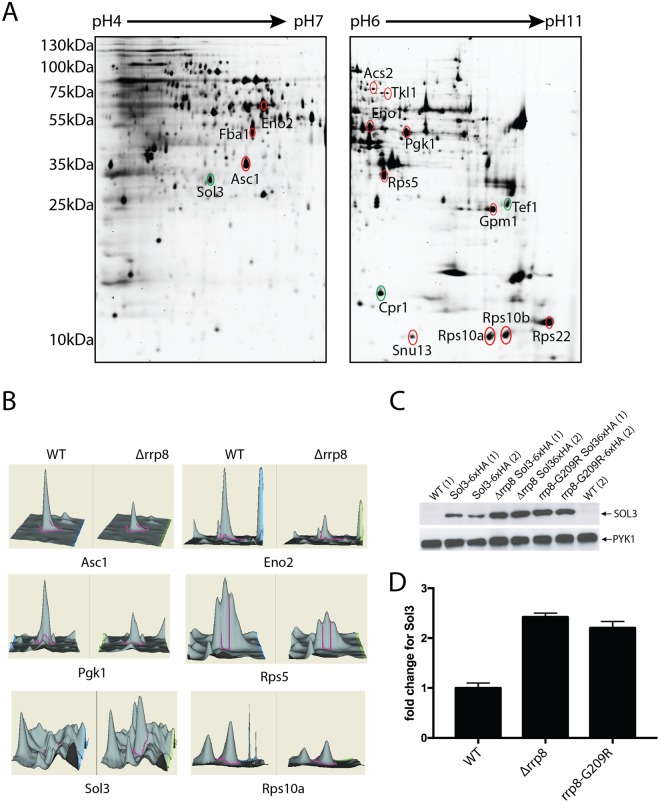
2D proteome analysis of rrp8 mutant. (A) Scanned images of a typical 2-D DIGE gel of 50 µg protein from the Cy3 labeled protein pool used for the rrp8 mutant strain (left gel: pH 4–7, right gel: pH 6–11). Differentially expressed proteins are annotated and were identified using ESI-MS/MS. Differentially expressed protein spots are annotated in red (down-regulated) or green (up-regulated). (B) DeCyder output showing the representative differentially expressed protein spots of Asc1, Eno2, Pgk1, Rps5, Sol3 and Rps10A along with their 3-D fluorescence intensity profiles. (C and D) Sol3 up-regulation is related to loss of m1A645 methylation. Western blot analysis using anti-HA antibodies to analyze the expression of 6xHA tagged SOL3 in wild-type, Δrrp8 and rrp8G209R mutant cells. As loading control, PYK1 was detected with a specific antibody. The represented fold changes in SOL3 expression were quantified using ImageJ software (http://imagej.nih.gov/ij/).

