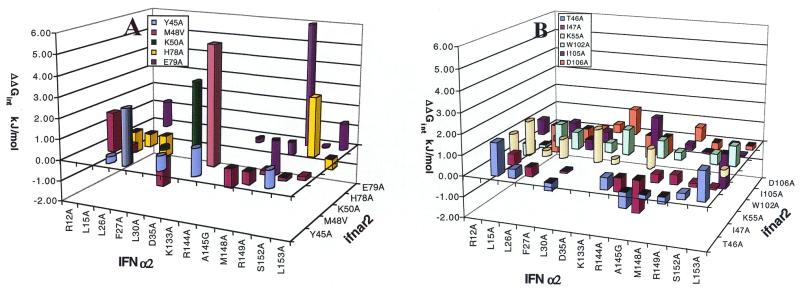
Figure 1.
DMC analysis of the IFN-α2–ifnar2 complex. Values of ΔΔGint determined from changes in kd or KD are presented as round and square bars, respectively. Data are from Table 1. (A) The calculated ΔΔGint values for residues where an interprotein interaction was identified (ΔΔGint > 2.5 kJ/mol). (B) The calculated ΔΔGint values for residues where no interprotein interaction was identified.

