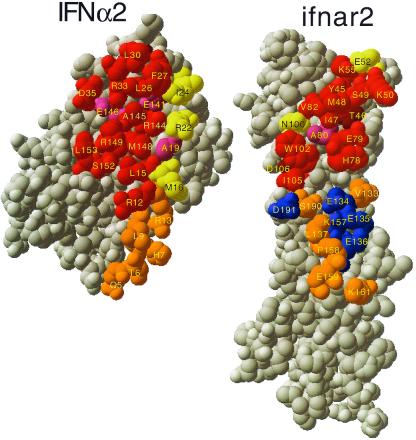
Figure 3.
Comparison of the mutual binding sites of IFN-α2 and ifnar2, as determined from mutagenesis, with the interface of the structure of the complex. The structure of the complex was opened up, by rotating IFN-α2 by 180°. Threshold for interface residues is 5 Å. Active residues are defined as those for which a mutation to Ala causes a decrease of at least 2-fold in binding affinity. Binding site residues were divided into those that interact with the C-terminal domain of ifnar2-EC (orange and blue) and the N-terminal domain of ifnar2-EC (all other colors). Red, active residues located within the binding site. Yellow, nonactive residues located in the binding site. Magenta, residues located in the binding site for which the activity was not determined. Brown, active residues located outside the binding site. Blue, residues located within the binding site of the second domain of ifnar2, but with no binding active. Orange, residues located within the binding site and the second domain of ifnar2, but with the activity not measured.

