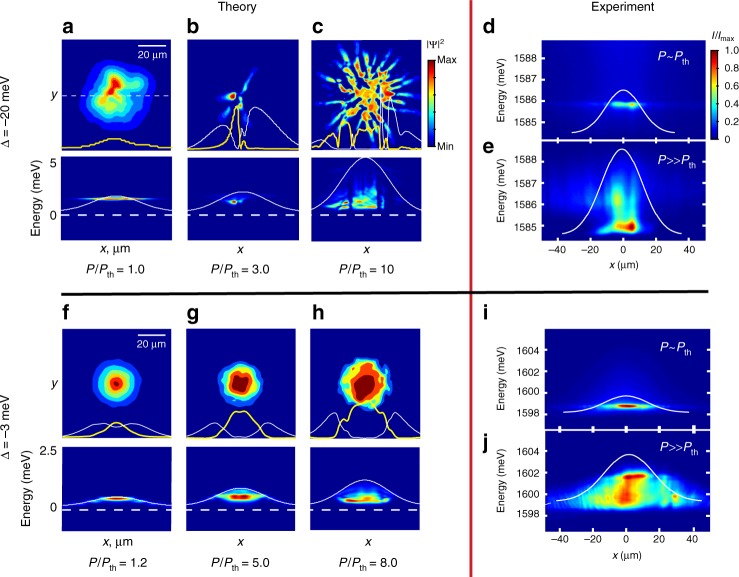
Fig. 5.
Theoretical results and spatially resolved energy measurements. a–c, f–h Numerically calculated single-shot real space density and corresponding lifetime-integrated real space spectra E(x) near and above the condensation threshold, for a–c highly photonic and f–h more excitonic polaritons. White and yellow curves in the single-shot density plots are the cross-sections of the reservoir (nR) and condensate (|ψ|2) densities, respectively. The |ψ|2 in a is scaled up by a factor of 30, nR is off the scale and is not shown. White solid curves in E(x) plots are the initial blue shifts, ER, due to a non-depleted reservoir density nR. Dashed lines correspond to the minimum of the LP dispersion. d, e and i, j Experimentally measured, time-integrated and ensemble-averaged spectra E(x) for the (d, e) photonic (Δ = −20 meV) and i, j more excitonic (Δ = −3 meV) polaritons. Panels d, i and e, j correspond to the at and above threshold regimes, respectively, which are similar to the points b and d in Fig. 1(f). White solid curves show non-depleted reservoir density nR deduced from numerical calculations

