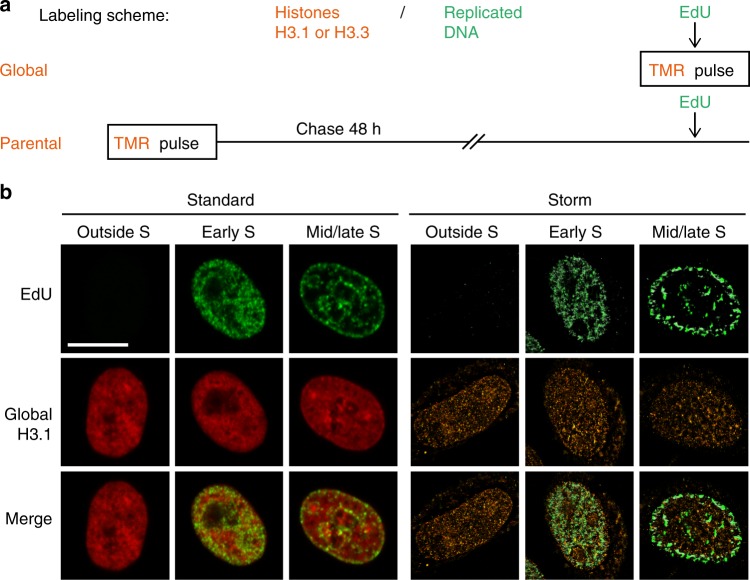
Fig. 2.
Tracking histone H3 variants with STORM microscopy. a Labeling scheme using H3.3- or H3.1-SNAP to follow global (top) or parental (bottom) histones. A pulse using the fluorophore TMR (orange) labels SNAP-tagged H3.3 or H3.1. EdU incorporation at the end of the assay allows the detection of replicated DNA (green). This EdU labeling is carried out either during the TMR pulse to compare global H3 distribution with patches of DNA synthesis or after a chase period that allows synthesis and deposition of new unlabeled H3.3- or H3.1-SNAP. The latter enables the localization of 48h-old parental histones with new patches of DNA synthesis. In all cases, we eliminate soluble histones by Triton extraction prior to fixation in order to analyze chromatin-bound H3.3 or H3.1 fractions. b Left panels: confocal images of global H3.1 (TMR, red) and replicated DNA (EdU, green) at different S-phase stages and outside S phase. Cells outside S phase are EdU negative, early S phase shows patterns broadly labeling the nucleus with the exception of the nucleoli and mid/late S phase shows patterns with clear enrichment at the nuclear periphery and around nucleoli. Right panels: STORM images of global H3.1 (TMR, orange) and replicated DNA (EdU, green) in cells outside S phase, early S phase and mid/late S phase. We used the ViSP software to render STORM images. Scale bars represent 10 μm

