Fig. 5.
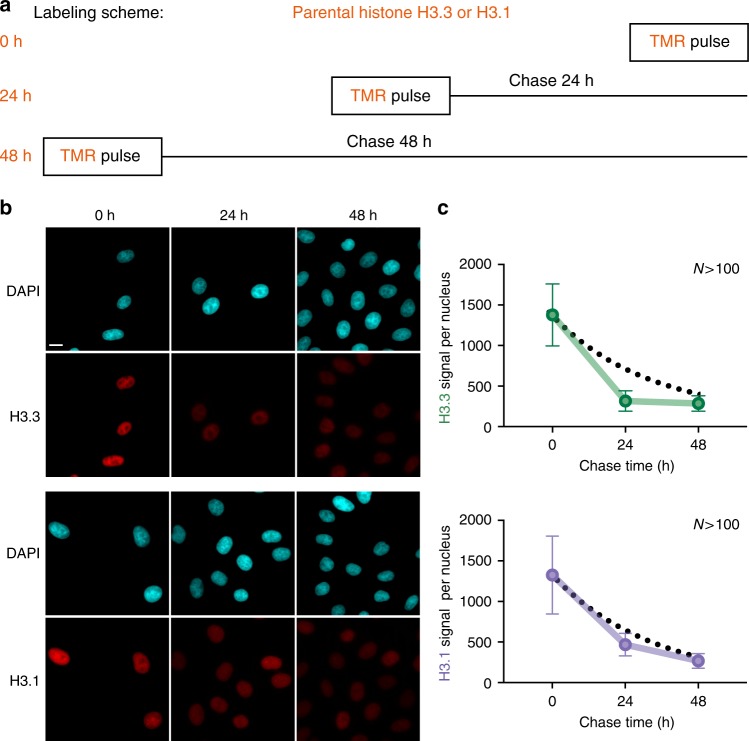
Tracking parental H3.3 and H3.1 a Labeling scheme using H3.3- or H3.1-SNAP to follow parental H3.3 or H3.1 as described in Fig. 2. We used three different chase times: 0, 24 and 48 h (equivalent to tracking global, 24 h-old and 48 h-old histones). b Standard epifluorescence images of histones H3.3 or H3.1 after a chase of 0, 24 and 48 h. DAPI stains nuclei. Scale bars represent 10 μm. c The plots show the quantification of the fluorescence for H3.3 or H3.1 after different chase times. More than 100 nuclei were quantified. Error bars represent standard deviation. Dashed lines correspond to how the signal would decrease by cell division-dependent dilution only, determined using the growth rate of each cell line HeLa H3.3- and H3.1-SNAP

