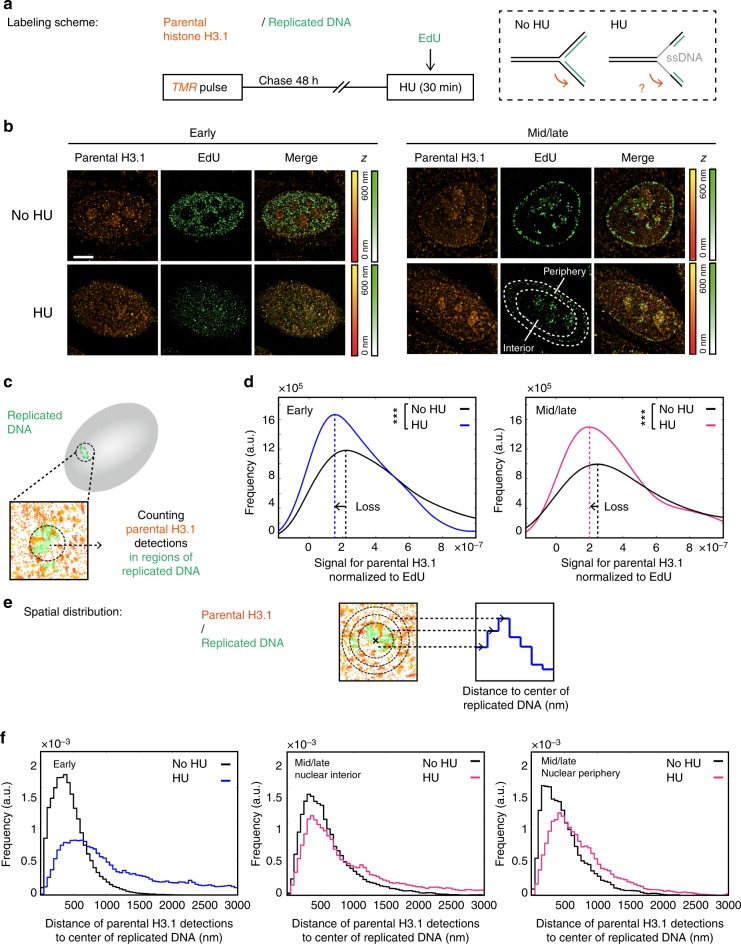
Fig. 6.
Effect of hydroxyurea treatment on parental H3.1 recycling at replication sites. a Labeling scheme using H3.1-SNAP to follow parental H3.1 as described in Fig. 2. In addition, we perform a 30 min hydroxyurea (HU) treatment prior to fixation. The dashed box depicts DNA at the replication fork with or without HU treatment: parental DNA (black), newly synthesized DNA (green) or single-stranded DNA (grey). b Representative STORM images of parental H3.1 (TMR, orange) and replicated DNA (EdU, green) in HeLa H3.1-SNAP in early and mid/late S phases. The color gradient corresponds to the z range. Scale bars represent 5 μm. c Calculation method for the signal for parental H3.1 normalized to EdU: in regions of replicated DNA, we counted parental H3.1 detections and normalized to the EdU detections and the total parental H3.1 detections in the nucleus. d Distribution of the signal for parental H3.1 (right) normalized to EdU in early S phase in control (No HU, black) and HU-treated cells (HU, blue or pink) in early (left) or mid/late (right) S-phase cells. In the No HU condition, N = 10 cells for early S and N = 9 cells for mid/late S phase. In the HU condition, N = 8 cells for early S and N = 10 cells for mid/late S phase. The p values (using Mann–Whitney–Wilcoxon test): ∗∗∗p ≤ 0.001; ns not significant. e Analysis method for the spatial distribution of parental H3.1 relative to replicated DNA. For each region of replicated DNA, we defined 50 nm wide concentric zones centered on the center of gravity of the replicated DNA site. We assigned surrounding detections of parental H3.1 to zones based on their distance to the center. The number of detections counted in each region was normalized to the volume of the corresponding region. f Spatial distribution of parental H3.1 relative to replicated DNA. The plots show the distributions of the distances of parental H3.1 to the center of replicated DNA sites for control (black) and HU-treated cells (blue or pink) in early S-phase cells (left), interior of mid/late S-phase cells (middle) and periphery of mid/late S-phase cells (right)

