Fig. 7.
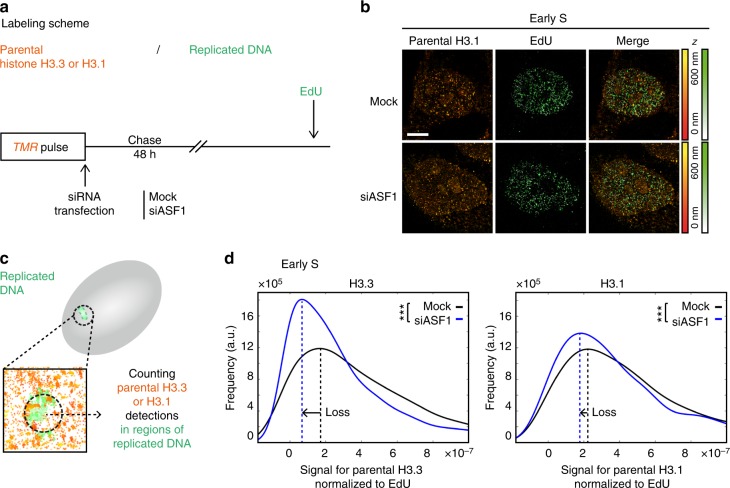
Effect of ASF1 depletion on the recycling of parental H3.3 and H3.1 at replicated DNA regions. a Labeling scheme using H3.3- or H3.1-SNAP to follow parental H3.3 or H3.1 as described in Fig. 2. In addition, we perform a siRNA transfection (mock or against ASF1) immediately following the TMR pulse labeling histones and prior to the 48 h chase. b Representative STORM images of parental H3.1 (TMR, orange) and replicated DNA (EdU, green) in HeLa H3.1-SNAP in early S phase. The color gradient corresponds to the z range. Scale bars represent 5 μm. c Calculation method for the signal for parental H3.3/1 normalized to EdU as described in Fig. 6c. d The plot shows the distribution of the signal for parental H3.3 (left) or H3.1 (right) normalized to EdU in early S phase in control (mock, black) and ASF1-depleted cells (siASF1, blue). For H3.3, in the mock condition, N = 11 cells, and in the siASF1 condition, N = 10 cells. For H3.1, in the mock condition, N = 10 cells, and in the siASF1 condition, N = 10 cells. The p values (using Mann–Whitney–Wilcoxon test): ∗∗∗p ≤ 0.001; ns not significant

