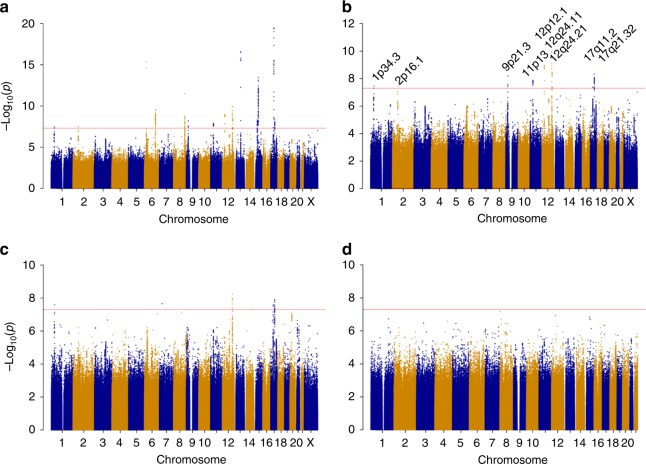
Fig. 1.
Manhattan plot of the results of the endometrial cancer meta-analysis of 12,906 cases and 108,979 controls. Genetic variants are plotted according to chromosome and position (x axis) and statistical significance (y axis). The red line marks the 5 × 10⁻⁸ GWAS significance threshold. a Endometrial cancer (all histologies). b Endometrial cancer (all histologies) excluding variants within 500 kb of previously published endometrial cancer variants. c Endometrioid histology endometrial cancer excluding variants within 500 kb of previously published endometrial cancer variants. d Non-endometrioid histology endometrial cancer

